-
 This training document is a Rego Consulting Quick Reference Guide to assist with the adding of URL links and use of the conversation functionality in Clarity’s Modern User Experience.
 -
 This training document is a Rego Consulting Quick Reference Guide to assist with the creation of Risks, Issues and Changes in Clarity’s Modern User Experience. Document covers both the creation and management of these items.
 -
 This training document is a Rego Consulting Quick Reference Guide to assist with creating a new project in Clarity’s Modern User Experience. The document reviews this both in the Project Page and in the Project Tiles locations.
 -
 This training document is a Rego Consulting Quick Reference Guide to assist with accessing the various project views in Clarity’s Modern User Experience. Reviews the Tile, Grid and Board views for projects.
 -
 This training document is a Rego Consulting Quick Reference Guide to assist with the process of converting an idea to a project in Clarity’s Modern User Experience.
 -
 This training document is a Rego Consulting Quick Reference Guide to assist with use of the Common Grid. You can find the grid throughout the application to manage projects, tasks, roadmaps, ideas, and timesheets to name a few. The QRG reviews View Options, Column Adjustments, the Details Panel and more.
 -
 This training document is a Rego Consulting Quick Reference Guide to assist with the use of the To Dos functionality in Clarity. It illustrates accessing the To Do list from the Menu and then the functionality of the To Do page.
 -
 This training document is a Rego Consulting Quick Reference Guide to assist with the My Tasks View in Clarity’s Modern User Experience. Guide shows how Tasks are access by use of the Task icon in the menu.
 -
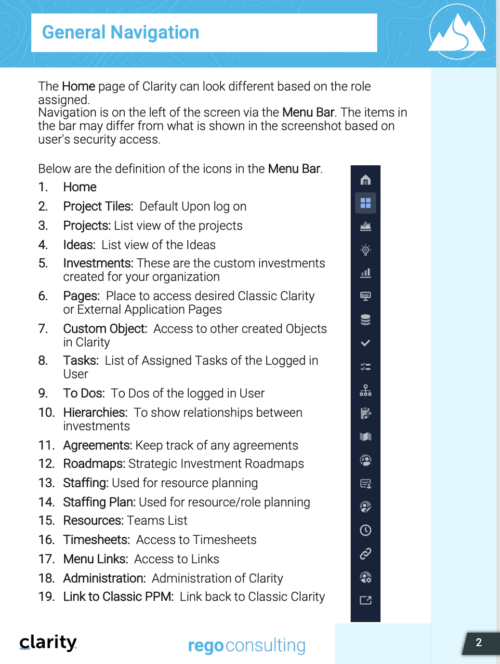
 This training document is a Rego Consulting Quick Reference Guide to assist with General Navigation in Clarity’s Modern User Experience. This doc references version 16.0 views. Doc reviews the Menu Bar and User Tool Bar.
 -
 A Quick Reference Guide to assist in the process of converting a Idea into an Investment in Clarity. Includes information on adding financial and resource data into the new investment.
 -
 A Quick Reference Guide to assist in creating and editing Project Baselines in Clarity Classic with the Phoenix theme.
 -
 A Quick Reference Guide to assist in the creation of a Project Status Report in Clarity. The document uses screen shots from the Classic UX with the Phoenix theme.
 -
 A Quick Reference Guide to assist with the creating and managing of Cost Plans in Clarity. The document uses screen shots from the Classic UX using the Phoenix theme.
 -
 A Quick Reference Guide to assist in the creation of risks, issues and change requests in Clarity. The document show this with screenshots from the Classic UX with the Phoenix theme.
 -
 A Quick Reference Guide to assist with Task Assignments in Clarity. The document shows screen shots from the Classic UX with the Phoenix theme.
 -
 A Quick Reference Guide to assist in the creation of Tasks using the Clarity Gantt. The screen shots utilize the Classic UX with the Phoenix theme.
 -
 A Quick Reference Guide to assist in the creation and editing of tasks using the Project Task List in Clarity. Screen shots are from the Classic UI, using the Phoenix Theme.
 -
 A Quick Reference Guide to assist in the process of staffing a Project Team in Clarity. The document uses screen shots from the Classic UX with the Phoenix theme.
 -
 A Quick Reference Guide to assist in the process of populating Project Properties. The document uses screen shots from the Classic UX with the Phoenix theme.
 -
 A Quick Reference Guide to assist in creating a project from a template in Clarity’s Classic UX. Document uses screen shots to walk through the process. Document uses the Phoenix Theme.
 -
 Rego’s training deck for Project Management in Clarity using the Classic UX and the Phoenix theme. Reviews the OBS, WBS, Templates, Terms, Allocation vs ETC and more.
 -
 A Rego training deck that walks through the various aspects of Open Workbench and offers tips and trick on using the tool to manage projects in sync with Clarity. Covers: Opening a plan, Multiple Staffing, Preference Options, Quick Access Toolbar, Quick Search and Quick Filter, Views and Filters, Copying Plans, Work Breakdown Structure, Dependencies, Assignments, Autoschedule, Baselining and Plan Closure.
 -
 A slide deck from Rego’s training class on Portfolio Management using Clarity’s Classic UX. Covers an introduction to Portfolio Management including definition, portfolio contents, PfM roles and responsibilities, how portfolios work, data used, key deliverables, prerequisites for starting PfM, and PfM security.
 -
 A Quick Reference Guide to assist in the creation and management of Status Reports in Clarity’s Modern UX. Reviews accessing the project details from the grid or tile view, creation of a new status report, existing status reports in Classic, updating status reports, customizing project status, and the project status list view.


Copyright 2023 • Rego Consulting Corporation • Privacy Policy