-
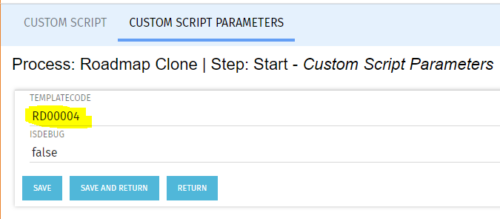 The Roadmap Cloning process creates a clone of any existing roadmap. It should be run using the “Execute a Process” job. To specify a roadmap to clone the Start Step Action’s Custom Script Parameters need to be updated to include the proper roadmap ID in the templateCode field.
 -
 Are you on an older version of CA PPM? Do you want to understand the value of the new features and functions in recent versions? Have you seen the new UX and do you wonder when is the right time to move over? This class is a demonstration of the new UX, new features in both classic and new UX, and the value of these features for customers.
 -
 Course Description: Do some folks in your organization view Clarity PPM as worthless or of little value? In this class, we will discuss how to increase the value perception of Clarity PPM and innovative ways to sell the value Clarity PPM provides to stakeholders and users.
 -
 Course Description: Are you ready to implement a continuous improvement practice within your PMO? This class is a working session to help build and sustain a continuous assessment initiative within your PMO, helping to manage goals and objectives from start-up through maturity. We will also discuss growth mapping to processes, tools, and strategic objectives.
 -
 Does your organization own Apptio or looking to purchase it? In this session we will dive into what Apptio is and how it complements your current Clarity solution.
 -
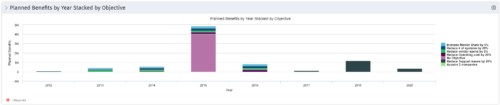 This Portlet starts by pulling Active Investments from a Classic UI Portfolio. It then looks for the Cost Plan of Record and its’ linked Benefit Plan. It then aggregates the Planned Benefit and groups it by Objective, then presents a stacked bar chart.
 -
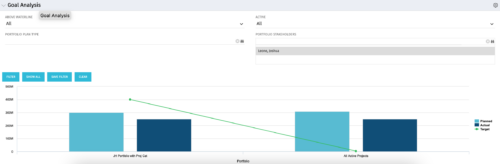 Part of our Business Transformation collection, this portlet relates exclusively to Benefit costs in the Portfolio and its investments. Portlet is a combination of Line Chart and Vertical Bar Charts. It displays data for one or more portfolios depending on rights and filters. Green Line represents Portfolio Target Benefits. Light blue bar represents aggregation of investment Planned Benefits. Dark blue bar represents aggregation of Investment Realized Benefits (actual benefits). Filtering is available for Above or Below Waterline investments OR all portfolio Investments. May also filter on Portfolio values as well as Plan values. Filtering also available for Active vs Inactive Portfolios.
 -
 Aligning work to organizational strategy is a fundamental requirement in today's ever-changing marketplace. High performing organizations are moving beyond basic connections to introduce strategic hierarchies that are tied to real measurements of business value via Clarity's Objectives and Key Results (OKRs). Join our expert guides as they present key concepts, best practices, and the evolution of strategic alignment.
 -
 Part of the Business Transformation collection, this pie chart portlet displays realized benefit, grouped by category for portfolio investments. It uses System Provider: Portfolio Investment Provider.
 -
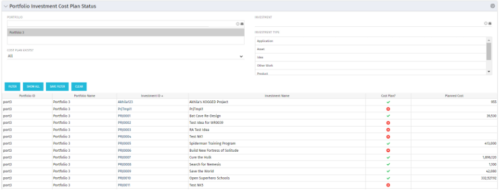 The portlet shows which investments within a portfolio has a cost plan and those that do not. For the ones which do have a cost plan, the Cost Plan? Field shows a Green checkmark. For the ones which do not have a cost plan, the Cost Plan? Field shows a Red cross.
 -
The portlet shows which investments within a portfolio has a cost plan and those that do not. For the ones which do have a cost plan, the Cost Plan? Field shows a Green checkmark. For the ones which do not have a cost plan, the Cost Plan? Field shows a Red cross.
-
The portlet shows which investments within a portfolio has a cost plan and those that do not. For the ones which do have a cost plan, the Cost Plan? Field shows a Green checkmark. For the ones which do not have a cost plan, the Cost Plan? Field shows a Red cross.


Copyright 2023 • Rego Consulting Corporation • Privacy Policy