-

 The Capacity Graph portlet displays Availability, Allocations, Actuals and Assignments for one or more active resource(s) in a single view. This portlet pulls data from timeslices, and allows the user to filter on a weekly, monthly or quarterly data. The Estimated Time to Complete (ETC) and Allocation data will only show for projects that are active. This portlet provides Resource Managers, PMOs and Executives with a simple way to analyse: Allocations vs. Availability, Allocations vs. Actuals, Allocations vs. ETC and ETC vs. Availability. The graph allows the user to determine where areas of improvement may exist and quickly identify potential areas of constraint. Note: the information displayed is dependent on what the user has security rights to view.
 -
 Prosci presents concepts on changing Portfolio Management. They share their approach on the people side of PfM, with a goal of addressing the saturation and collision of multiple projects, initiatives or work efforts.
 -
 Are you struggling with implementing Agile tools in your organization in addition to Clarity? This class will review best practices for implementing Agile tools in conjunction with Clarity - living in a Bi-Modal world. We will discuss how Clarity can be used to govern both types of work and teams and how Agile tools should interface into Clarity.
 -
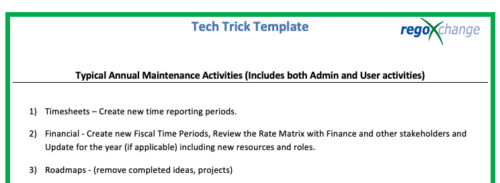 This is a list of 12 typical maintenance items that should be completed for Clarity on an annual basis. There is also a short list of items that should be completed periodically depending on client policies.
 -
 ** No Download - Do not Add to Cart** - Register for the White Paper at this link - http://info.regoconsulting.com/clarity-roadmaps-fastest-route-to-success Anyone who’s taken a road trip knows the value of a good map. It tells you where you’re going, how long it might take to get there, and where you are at any given time. Your organization’s strategic journey is no different. Whether it’s your corporate strategy or individual investments, you’re heading into territory that could include all kinds of intersections, delays, and detours that could impact your plan. A good roadmap will give you the critical information you need to ensure a smooth journey. In this white paper, we discuss how using Clarity's Roadmap feature will get you pointed in the right direction for success.
 -
 This asset in used to update investment level TSV attributes using Cost Plan, Budget plan, Actual transaction, Planned and Budgeted Benefit Cost data as needed. It uses mappings/logic from ‘Cost Rollup Mappings’ object. Compatibility – Its compatible from 16.0 onwards with Oracle, PostgreSQL and MSSQL.
 -
 A Quick Reference Guide on setting up Custom Investments in Clarity’s Modern UX. Reviews setting up the Custom Investment, and creating Custom Investment Records.
 -
 A Quick Reference Guide to assist in the creation of portfolios and adding investments in Clarity’s Classic UX. Reviews the steps to create a portfolio, process of adding the investments, and syncing the data.
 -
 Discount Tire shares their Project Prioritization Model. It’s based on the Analytic Hierarchy Process (AHP) created in the 1970’s. It breaks down decisions into a hierarchal structure and combines both objectivity and subjectivity into a standard numerical scale.
 -
 A presentation slide deck from Rego University 2022. This document reviews the use of the new Hierarchy feature in Clarity.
- Introduction
- General Value of a Hierarchy
- When to use the Hierarchy in Clarity –
- Live Demo
- Use Cases
-
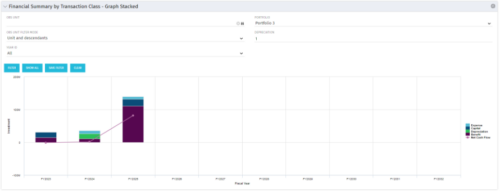 This stacked bar graph portlet displays the financial summary by transaction class for the current and future fiscal annual periods. Filters are provided for:
- OBS
- Portfolio
-
This stacked bar graph portlet displays the financial summary by transaction class for the current and future fiscal annual periods. Filters are provided for:
- OBS
- Portfolio


Copyright 2023 • Rego Consulting Corporation • Privacy Policy