-
 This training document is a Rego Consulting Quick Reference Guide to assist with General Navigation in Clarity’s Modern User Experience. This doc references version 16.1 views. Doc reviews the Menu Bar and User Tool Bar. Document provides instructions on how to access blueprints, create a new blueprint and edit the fields available on the blueprint. Detail is also provided on how to update the modules, rules and actions associated with a blueprint. Instructions are listed to show the user how to modify the create from template page, how to add a new channel and how to set a default blueprint. Tips on the user of the API Attribute ID are also provided.
 -
 This training document is a Rego Consulting Quick Reference Guide to assist with the management of Custom Investment Types in Clarity’s Modern User Experience. This doc references version 16.1 views. Document provides detail on how to create a Custom Investment Type and how to create Custom Investment records from the Grid View and the Board View.
 -
 This training document is a Rego Consulting Quick Reference Guide to assist with the management of Custom Investments in Clarity’s Modern User Experience. This doc references version 16.1 views. Document provides detail on how to navigate to custom investments and provides detail on the modules that are available within a custom investment.
 -
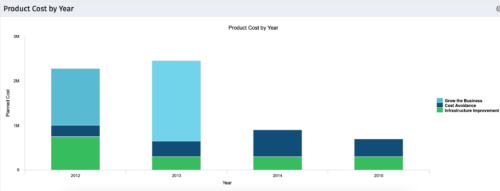 The Product Cost by Year portlet displays active product cost by year, summarized by goal. The product cost is pulled from the product’s planned cost and is displayed by year, with colors representing each product goal. This portlet provides management with a quick overview of all product costs without having to navigate to each product individually.
 -
The Product Cost by Year portlet displays active product cost by year, summarized by goal. The product cost is pulled from the product’s planned cost and is displayed by year, with colors representing each product goal. This portlet provides management with a quick overview of all product costs without having to navigate to each product individually.
-
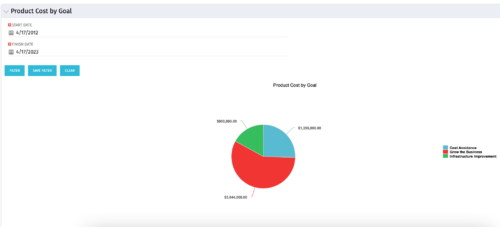 The Product Cost by Goal portlet displays the planned cost of all active products within a timeframe, summarized by goal in a pie chart. This portlet provides management with a quick overview of cost by goal within a year without navigating to each product individually.
 -
The Product Cost by Goal portlet displays the planned cost of all active products within a timeframe, summarized by goal in a pie chart. This portlet provides management with a quick overview of cost by goal within a year without navigating to each product individually.
-
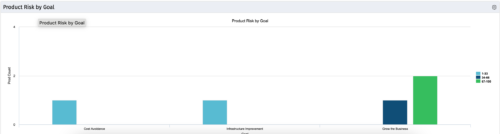 The Product Risk by Goal portlet displays a count of active products by goal with a sub-count by risk. The graph is color-coded by risk rating:
- 1-33 – Green
- 34-66 – Yellow
- 67-100 – Red
-
The Product Risk by Goal portlet displays a count of active products by goal with a sub-count by risk. The graph is color-coded by risk rating:
- 1-33 – Green
- 34-66 – Yellow
- 67-100 – Red
-
 Pie Chart displays count of all Ideas by Department. Filterable by Active and Inactive, by OBS, and by Department Manager. Data label and mouse-over show department counts. Legend displays department names.
 -
Pie Chart displays count of all Ideas by Department. Filterable by Active and Inactive, by OBS, and by Department Manager. Data label and mouse-over show department counts. Legend displays department names.
-
 Pie Chart displays total Ideas by Priority, filterable by Active / Inactive and by OBS structure. Data Label and Mouse-over label display counts by Priority. Legend shows Priority Name. Chart also shows Ideas with No Priority.


Copyright 2023 • Rego Consulting Corporation • Privacy Policy