-
 Course description: “People are the #1 key to successful implementation, acceptance and sustaining adoption after the project is long gone. Find out some tips and tricks on how to keep those key stakeholders engaged.” Download file is the presentation slide deck.
 -
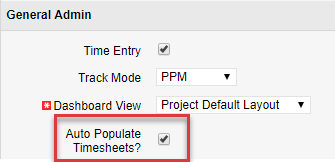
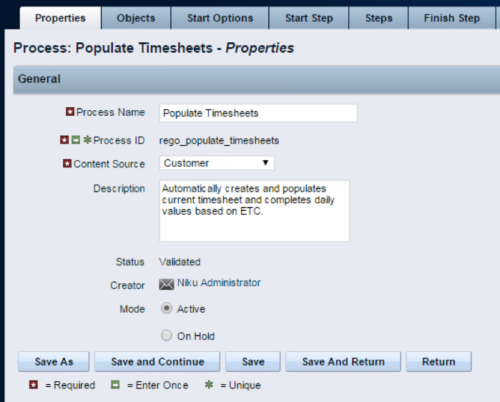 The Populate Timesheets process converts task level ETC into time entered on the timesheet. The process relies on the resource “opting in” to the process by checking a new attribute called “Auto Populate Timesheet?”, as well as the project manager “opting in” at the project level via a new attribute called “Auto Populate Timesheet?” Once the resource opts in and the PM opts in, the process will create a timesheet for the resource, pulling in the ETCs for the tasks that week and moving them to the actual hours. Once the process runs, an email will be sent to the resource letting them know the hours have been applied.
 -
 Course Description: Does your organization struggle to understand your fully burdened TCO for the applications that enable your business? Do you use spreadsheets and disparate data sources to manually calculate TCO? This session explores the data sources needed to calculate the fully burdened TCO for applications. We will also cover marketplace tools that allow you to track spending, providing trends of applications broken down by run and development costs.
 -
 Course Description: Do you know what PPM, APM, Agile, ITFM, and other tools are available in the marketplace? Have you taken a strategic look at the key IT processes and tools that exist to support them? Have you been asked to evaluate and recommend a PPM tool? This class will review other ITBM tools and examine their pros and cons. We will also provide six keys to evaluating a PPM solution.
 -
 Funnel Chart displays aggregated counts of Ideas by “Idea Progress”, a custom attribute. Chart shows Idea Progress names in legend, and count total is available as a mouse-over. No filters available on this portlet.
 -
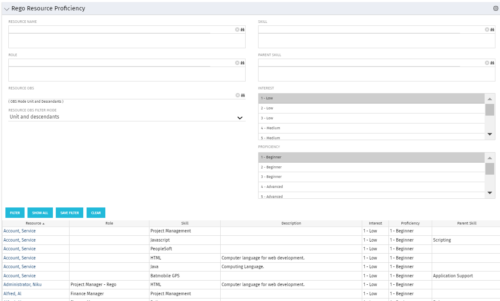 This grid displays Skill Proficiency and Interest Level by Resource. Users can utilize this view to search for Resources by Skill, Parent Skill, Interest, Role, Parent Role, Resource and Resource OBS. This portlet grants a Project Manager or Resource Manager the ability to determine which Resources best fit the needs for their project.
 -
This grid displays Skill Proficiency and Interest Level by Resource. Users can utilize this view to search for Resources by Skill, Parent Skill, Interest, Role, Parent Role, Resource and Resource OBS. This portlet grants a Project Manager or Resource Manager the ability to determine which Resources best fit the needs for their project.
-
 Pie Chart displays total Ideas by Priority, filterable by Active / Inactive and by OBS structure. Data Label and Mouse-over label display counts by Priority. Legend shows Priority Name. Chart also shows Ideas with No Priority.
 -
 Pie Chart displays count of all Ideas by Department. Filterable by Active and Inactive, by OBS, and by Department Manager. Data label and mouse-over show department counts. Legend displays department names.
 -
Pie Chart displays count of all Ideas by Department. Filterable by Active and Inactive, by OBS, and by Department Manager. Data label and mouse-over show department counts. Legend displays department names.
-
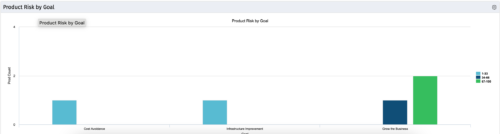 The Product Risk by Goal portlet displays a count of active products by goal with a sub-count by risk. The graph is color-coded by risk rating:
- 1-33 – Green
- 34-66 – Yellow
- 67-100 – Red
-
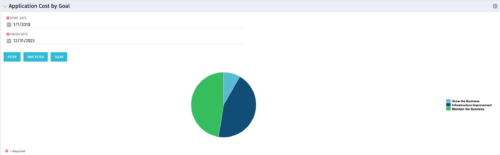 The Application Cost by Goal portlet displays the planned cost of all active applications within a user-defined timeframe, summarized by goal in a pie chart. This portlet provides management with a quick overview of cost by goal within a year without navigating to each application individually.
 -
The Application Cost by Goal portlet displays the planned cost of all active applications within a user-defined timeframe, summarized by goal in a pie chart. This portlet provides management with a quick overview of cost by goal within a year without navigating to each application individually.
-
 The Application Cost by Year portlet displays the active application cost by year, summarized by goal. The application cost is pulled from the application's planned cost and is displayed by year, with colors representing each application goal. This portlet provides management with a quick overview of all application costs without having to navigate to each application individually.
 -
The Application Cost by Year portlet displays the active application cost by year, summarized by goal. The application cost is pulled from the application's planned cost and is displayed by year, with colors representing each application goal. This portlet provides management with a quick overview of all application costs without having to navigate to each application individually.
-
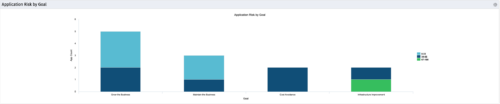 The Application Risk by Goal portlet displays a count of active applications by goal with a sub-count by risk. The graph is color-coded by risk rating:
- 1-33 – Green
- 34-66 – Yellow
- 67-100 – Red
-
The Application Risk by Goal portlet displays a count of active applications by goal with a sub-count by risk. The graph is color-coded by risk rating:
- 1-33 – Green
- 34-66 – Yellow
- 67-100 – Red
-
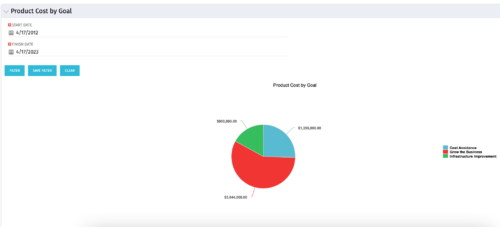 The Product Cost by Goal portlet displays the planned cost of all active products within a timeframe, summarized by goal in a pie chart. This portlet provides management with a quick overview of cost by goal within a year without navigating to each product individually.
 -
The Product Cost by Goal portlet displays the planned cost of all active products within a timeframe, summarized by goal in a pie chart. This portlet provides management with a quick overview of cost by goal within a year without navigating to each product individually.
-
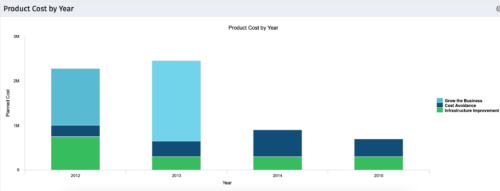 The Product Cost by Year portlet displays active product cost by year, summarized by goal. The product cost is pulled from the product’s planned cost and is displayed by year, with colors representing each product goal. This portlet provides management with a quick overview of all product costs without having to navigate to each product individually.
 -
 This training document is a Rego Consulting Quick Reference Guide to assist with the management of Custom Investments in Clarity’s Modern User Experience. This doc references version 16.1 views. Document provides detail on how to navigate to custom investments and provides detail on the modules that are available within a custom investment.
 -
 The Capacity Graph - Investment portlet displays Availability, Allocations, Assignments and Actuals for active resources in a single project. This portlet pulls from timeslices and allows the user to filter on weekly, monthly, or quarterly data. This portlet provides a Project Manager with a simple way to analyse: Allocations vs. Actuals and Allocations vs. ETC. Depending on metric goals, the graph allows the user to determine where areas of improvement may exist.
 -
 The All Issues portlet displays all Issues related to active projects that the logged in user has view rights to. The portlet provides the project manager a single place to view issues across multiple projects without having to go into each project individually, and allows for more efficient management and reporting across projects. The filter then allows the user to narrow their search by Issue ID, Issue Name, Project ID, Project Name, the individual to whom the issue is assigned, and Issue Status. You may also narrow the view to display issues with a target resolution date within a certain date range, or Issues associated with a particular Category or OBS unit. Note: Only the projects that the user has viewer rights to will show up in the list.


Copyright 2023 • Rego Consulting Corporation • Privacy Policy