-
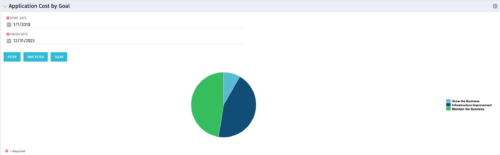 The Application Cost by Goal portlet displays the planned cost of all active applications within a user-defined timeframe, summarized by goal in a pie chart. This portlet provides management with a quick overview of cost by goal within a year without navigating to each application individually.
 -
The Application Cost by Goal portlet displays the planned cost of all active applications within a user-defined timeframe, summarized by goal in a pie chart. This portlet provides management with a quick overview of cost by goal within a year without navigating to each application individually.
-
 The Application Cost by Year portlet displays the active application cost by year, summarized by goal. The application cost is pulled from the application's planned cost and is displayed by year, with colors representing each application goal. This portlet provides management with a quick overview of all application costs without having to navigate to each application individually.
 -
The Application Cost by Year portlet displays the active application cost by year, summarized by goal. The application cost is pulled from the application's planned cost and is displayed by year, with colors representing each application goal. This portlet provides management with a quick overview of all application costs without having to navigate to each application individually.
-
 Course Description: Does your organization want to implement application portfolio management (APM)? Are you trying to determine the value in implementing APM? Are you struggling to know what tool you should use and what data is important to collect? This session will review specific use cases of companies that have implemented APM and effectively used the data to drive value for the organization.
 -
 Course Description: A review of the basics around APM. Covering Business Capabilities, Application Scoring, and Best Practices.
 -
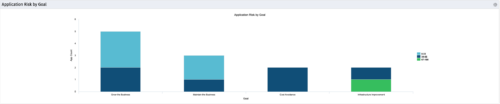 The Application Risk by Goal portlet displays a count of active applications by goal with a sub-count by risk. The graph is color-coded by risk rating:
- 1-33 – Green
- 34-66 – Yellow
- 67-100 – Red
-
The Application Risk by Goal portlet displays a count of active applications by goal with a sub-count by risk. The graph is color-coded by risk rating:
- 1-33 – Green
- 34-66 – Yellow
- 67-100 – Red
-
The Application Risk by Goal portlet displays a count of active applications by goal with a sub-count by risk. The graph is color-coded by risk rating:
- 1-33 – Green
- 34-66 – Yellow
- 67-100 – Red
-
 Course Description: “For clients that have both ServiceNow and CA PPM, passing information between the systems becomes vital for the enterprise with both ITSM and PPM toolsets. One of the biggest areas of interaction is around Demand Management. Come and see Rego's Integration solution which flexibly allows for ServiceNow records (Incident, Problem, Idea, Enhancement, and Demands) to generate CA PPM Ideas or Projects. This lets you control where you want to perform Demand Management, and the work lands in CA PPM's Project either way.” Download is the slide deck used for the presentation.
 -
 This portlet pulls back the Availability and Allocation totals by Role between a user-specified Start and Finish Date, then the user can drilldown to look at the information for Applications. The Time Period filter allows for comparing these values across different timeframes (monthly, weekly, quarterly, annual) as desired. Other filters allow for looking at Active or Inactive Roles (or both) and including Active or Inactive Projects (or both) in the totals.


Copyright 2023 • Rego Consulting Corporation • Privacy Policy