-
 Do you want to report on TCO for your organization by business function, application, or service? This should be the financial management goal of every organization. This class will discuss a path and some architecture choices to make this a reality. We will highlight want some customers are doing today and share some best practices on the journey.
 -
 Many organizations have a goal to understand, track, and control the TCO of applications or services, but it can be challenging to accomplish. In this session, we'll discuss what makes TCO so important, important decisions you'll need to consider along the way, and some best practice guidance on reaching your TCO goal.
 -
 To effectively practice Agile at scale, Clarity teams first need to identify various needs. This includes thinking through considerations for funding, investment prioritization, and spend management practices.
 -
 Most organizations struggle with collaborating across frameworks. Those managing FinOps activities, the TBM office, and Agile delivery teams are operating in silos, but there is a better way forward. In this class we’ll go through some strategies of bringing teams together to improve business outcomes through collaboration.
 -
 A presentation slide deck from Rego University 2022. A class about the goal of TCO and what it takes to achieve it.
- TCO Benefits
- Best Practices
- Deployment Tips
-
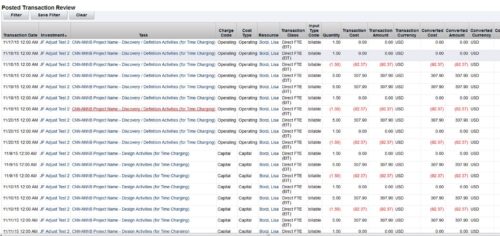 This is an automation to adjust the cost in financials (WIP) based on the standard weekly hours for salaried (Exempt) personnel. The process adjusts only the cost in WIP where the hours per week that are posted for a resource are more than the standard work week. The Posted hours in the timesheet and in WIP remain untouched. For the process to calculate correctly, all time in a given week needs to be accounted for, including all non-project time. The process has three input parameters as explained below:
- wkStdHour: Standard Weekly Hours; this can be changed in the process gel script. The parameter is based on the organization standard work week. The default is set to 40 hours.
- xogBatchSize: The XOG batch size. This is used to upload data in batches to avoid high memory and performance issues. The default batch size is set to 50 records.
- username: The resource name that the process uses for uploading data. The default is set to admin.
- It will process all the timesheets in posted state provided the timesheet has not been adjusted earlier by this process and there are no pending transactions to be posted for it. Validation is made based on Notes field, which is populated once adjustment is done by the process.
- Notes field should not be modified in Script nor should be worked upon by any other process.
- All the invalid transactions should be cleared and post to WIP should be finished with no pending records.
-
 The Timesheet Notes portlet displays all timesheet notes split out by resource, investment and task. This is very useful in situations where you want to review multiple notes as you do not have to open each note separately. The table below describes the available filter fields in the portlet.
Column Label Description Timesheet Period Start Range of time periods to display filtered by start date Timesheet Period Finish Range of time periods to display filtered by finish date Resource Resource(s) to display Type Note on a timesheet or time entry (task specific) -
The Timesheet Notes portlet displays all timesheet notes split out by resource, investment and task. This is very useful in situations where you want to review multiple notes as you do not have to open each note separately. The table below describes the available filter fields in the portlet.
Column Label Description Timesheet Period Start Range of time periods to display filtered by start date Timesheet Period Finish Range of time periods to display filtered by finish date Resource Resource(s) to display Type Note on a timesheet or time entry (task specific) -
 A .pdf file that has the slide by slide presentation at 2015 RegoU on the elements of Financial Processing in CA PPM. The agenda covers a financial process overview, enabling time reporting, enabling financials, posting timesheets, transaction entries, posting to WIP, adjustments, importing financial actuals, and job scheduling.
 -

The Transaction Adapter – is a text based CSV file which automates the importing of monthly non labor financial data into Clarity directly from your financial system. This integration eliminates the need to create non-labor transactions manually in Clarity and will provide more accurate project, program, and portfolio financial reporting. -
 By its very nature, the shift to Product Funding is going to require that tracking of that funding. Agile tools do not have much, if any, financial capabilities, so it is important to create an eco-system that can support this value stream—from funding, through delivery, and finally to tracking the realization of financial value. Learn how Rally and Clarity PPM do this very well together.


Copyright 2023 • Rego Consulting Corporation • Privacy Policy