
274 results
-
 A presentation slide deck from RegoU 2023. This course covered innovation items that Rego has created to enhance the usability for Apptio.
 -
 Part of the Business Transformation collection, this line chart portlet displays realized vs planned benefits overtime, for portfolio investments. This provides the PfM with a holistic view of benefits planned vs realized over a period of time.
 -
Part of the Business Transformation collection, this line chart portlet displays realized vs planned benefits overtime, for portfolio investments. This provides the PfM with a holistic view of benefits planned vs realized over a period of time.
-
Part of the Business Transformation collection, this line chart portlet displays realized vs planned benefits overtime, for portfolio investments. This provides the PfM with a holistic view of benefits planned vs realized over a period of time.
-

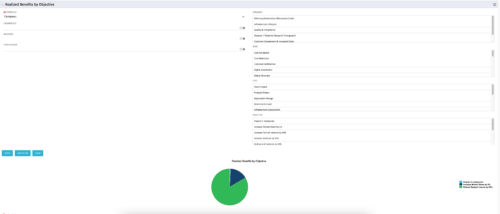 This portlet displays a Pie Chart of a Portfolio’s Realized Benefits partitioned into pie slices by the portfolio’s Investments’ Objectives. Clicking on any pie slice (Objective) drills-down into a portlet that lists the Investments that make up that slice.
 -
This portlet displays a Pie Chart of a Portfolio’s Realized Benefits partitioned into pie slices by the portfolio’s Investments’ Objectives. Clicking on any pie slice (Objective) drills-down into a portlet that lists the Investments that make up that slice.
-
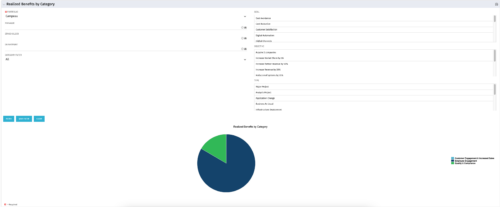 This is a pie chart portlet to show realized benefits across the system by category, including a category for no category or unspecified. Pie chart shows categories of realized benefits in its slices. Available filters:
- Portfolio (required)
- Manager
- Stakeholder
- Department
- Category Filter (default to all)
- Goal
- Objective
- Type
-
This is a pie chart portlet to show realized benefits across the system by category, including a category for no category or unspecified. Pie chart shows categories of realized benefits in its slices. Available filters:
- Portfolio (required)
- Manager
- Stakeholder
- Department
- Category Filter (default to all)
- Goal
- Objective
- Type
-
 Part of the Business Transformation collection, this pie chart portlet displays realized benefit, grouped by location of project. This provides the PM with a holistic view of benefits realized across the geographical locations.
 -
Part of the Business Transformation collection, this pie chart portlet displays realized benefit, grouped by location of project. This provides the PM with a holistic view of benefits realized across the geographical locations.
-
Part of the Business Transformation collection, this pie chart portlet displays realized benefit, grouped by location of project. This provides the PM with a holistic view of benefits realized across the geographical locations.
