-
 It is quite common for Rally and Jira to coexist. However, connecting them effectively enhances the value stream for development teams and product owners. Learn what is available to make this happen along with some typical design patterns.
 -
 In this session we will explore complex cloud use cases you can manage within ApptioOne, including accruals, forecasting, multi-cloud chargeback, RI waste analysis, and reallocations. Additionally, we will discuss Cloud Business Management reporting and its role in driving accountability, optimizing cloud spend, and creating custom reports for various roles. Join us to learn how ApptioOne can empower you to navigate today's multi-cloud environments and enhance your cloud management strategy.
 -
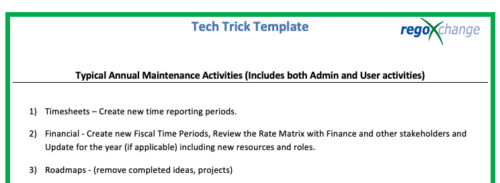 This is a list of 12 typical maintenance items that should be completed for Clarity on an annual basis. There is also a short list of items that should be completed periodically depending on client policies.
 -
 Are you struggling with implementing Agile tools in your organization in addition to Clarity? This class will review best practices for implementing Agile tools in conjunction with Clarity - living in a Bi-Modal world. We will discuss how Clarity can be used to govern both types of work and teams and how Agile tools should interface into Clarity.
 -
 Are you struggling with implementing Agile tools in your organization in addition to Clarity? This class will review best practices for implementing agile tools in conjunction with Clarity - living in a Bi-Modal world. We will discuss how Clarity can be used to govern both types of work and teams and how Agile tools should interface into Clarity.
 -
 A presentation slide deck from Rego University 2022. This class reviewed the importance of an application health check, optimization and tuning.
- Checking Apptio Version
- Tools Overview
- Configuration Tips
-
 Uncover the advantages of shifting from showback to chargeback and learn how to successfully execute chargeback within your organization. In this session, we will delve into chargeback processes, focusing on industry best practices and offering expert guidance on designing and implementing effective chargeback strategies. Additionally, we will explore the utilization of the Bill of IT as a powerful tool to reinforce your chargeback approach.
 -
 Are you considering the use of CA PPM's benefits tracking for planned and/or realized benefits? This session will be a review of common use cases for putting benefits forecasts and realized benefits into CA PPM along with the reporting available out of the box and within RegoXchange.
 -
 A presentation slide deck from Rego University 2022. This course reviewed the value of a strategic roadmap for TBM.
- Defining the Value of a Strategic Roadmap
- Roadmapping Methodology
- Best Practices
- TBM Roadmap Examples
-
 This portlet shows the variance between the budgeted cost and the planned cost for projects. This allows for the variance to be displayed between what was planned and what was approved. This provides the PMs with the ability to better plan the costs.
 -
This portlet shows the variance between the budgeted cost and the planned cost for projects. This allows for the variance to be displayed between what was planned and what was approved. This provides the PMs with the ability to better plan the costs.
-
This portlet shows the variance between the budgeted cost and the planned cost for projects. This allows for the variance to be displayed between what was planned and what was approved. This provides the PMs with the ability to better plan the costs.


Copyright 2023 • Rego Consulting Corporation • Privacy Policy