-
 Pie Chart displays count of all Ideas by Department. Filterable by Active and Inactive, by OBS, and by Department Manager. Data label and mouse-over show department counts. Legend displays department names.
 -
Pie Chart displays count of all Ideas by Department. Filterable by Active and Inactive, by OBS, and by Department Manager. Data label and mouse-over show department counts. Legend displays department names.
-
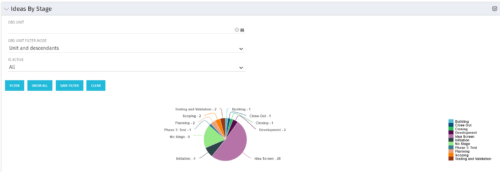 Pie Chart displays count of all Ideas by stage. Filterable by Active and Inactive, and also by OBS. Data label and mouse-over show Stage counts. Legend displays Stage names. This portlet assumes the use of the custom Stage attribute on Idea object.
 -
Pie Chart displays count of all Ideas by stage. Filterable by Active and Inactive, and also by OBS. Data label and mouse-over show Stage counts. Legend displays Stage names. This portlet assumes the use of the custom Stage attribute on Idea object.


Copyright 2023 • Rego Consulting Corporation • Privacy Policy