-
 Over time notifications can build up in the CA PPM system and should be purged, so as not to hinder performance. The SQL statements mentioned in the tech doc can be implemented within a process in CA PPM to either purge notifications on an ongoing basis or remove all of them at once.
 -
 How do you prioritize work? In many organizations, the traditional forced ranking scale (1-x) alone just isn’t sufficient. There are financial and resource constraints to consider. We must also align with strategic objectives, OKRs, or business outcomes. So how do we go about creating a plan which layers in-flight and proposed work within all these considerations, to create a balanced and prioritized roadmap? How do you drive priorities without driving yourselves crazy? In this session, we will share best practices and lessons learned. You will get a hands-on exploration of a practical, realistic, and flexible approach for bringing all the pieces together to satisfy your organization's planning needs.
 -
 Course Description: The concepts of creativity are tools and habits that help you and your team become more creative. During this session, you will learn simple tricks and methods to encourage a more creative environment within your teams. Creativity training includes emotional intelligence and behavioral aspects, all-in-one.
 -
 "The concepts of creativity are tools and habits that help you and your team become more creative. During this session, you will learn simple tricks and methods to encourage a more creative work environment. Join this session to learn how to structure an effective team meetings, workshops and all-inclusive ideation sessions. Even learn about some great work habits to boost your career! "
 -
 With its end-to-end capabilities and aggregated data, ValueOps is an ideal platform on which to build the ultimate AI for value stream management. In this must-see session, Jean-Louis Vignaud, Head of ValueOps, will outline his vision of how our next generation of AI features will help deliver curated visibility, guided alignment, and augmented efficiency to the enterprise.
 -
 Join this session to learn best practices of when to use what module in Clarity (roadmaps vs hierarchies, CITs vs Projects...). Let’s really look at the power and adaptability of Modern UX features, through the lens of finding the best fit to meet the needs of your end users and business processes.
 -
 Join this session for best practices in optimizing Clarity's Modern UX modules. Learn how - and when - to use specific modules in Clarity (roadmaps vs hierarchies, CITs vs Projects, etc.). Let’s really dive into the power and adaptability of Modern UX features, through the lens of finding the best fit to meet the needs of your end users and business processes.
 -
 How do you address ever-growing backlogs and impatient demands from internal or external customers, while also balancing the desire to innovate with the need to maintain high performance and quality? This session focuses on proven techniques - learned over several years and iterations - to help win the battle against these challenges.
 -
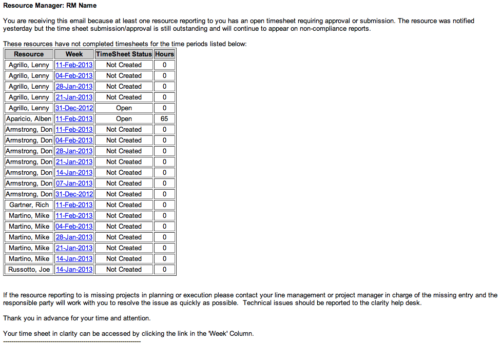 The Time Tracking Stalker - RM workflow process automatically sends an email to Resource Managers for each one of their resources that have not submitted their timesheet for a prior open time period, thus informing the RM if their resources are submitting their timesheets on time. Project Managers will also benefit since the notifications will help to ensure that time is being posted against their projects in a timely manner, helping to provide them with an accurate view of time expended on the projects.
 -
The Time Tracking Stalker - RM workflow process automatically sends an email to Resource Managers for each one of their resources that have not submitted their timesheet for a prior open time period, thus informing the RM if their resources are submitting their timesheets on time. Project Managers will also benefit since the notifications will help to ensure that time is being posted against their projects in a timely manner, helping to provide them with an accurate view of time expended on the projects.
-
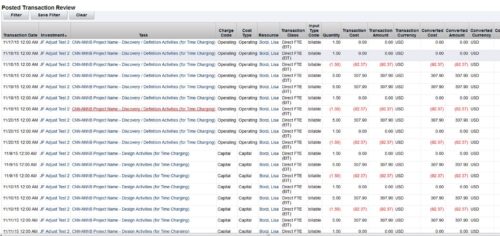 This is an automation to adjust the cost in financials (WIP) based on the standard weekly hours for salaried (Exempt) personnel. The process adjusts only the cost in WIP where the hours per week that are posted for a resource are more than the standard work week. The Posted hours in the timesheet and in WIP remain untouched. For the process to calculate correctly, all time in a given week needs to be accounted for, including all non-project time. The process has three input parameters as explained below:
- wkStdHour: Standard Weekly Hours; this can be changed in the process gel script. The parameter is based on the organization standard work week. The default is set to 40 hours.
- xogBatchSize: The XOG batch size. This is used to upload data in batches to avoid high memory and performance issues. The default batch size is set to 50 records.
- username: The resource name that the process uses for uploading data. The default is set to admin.
- It will process all the timesheets in posted state provided the timesheet has not been adjusted earlier by this process and there are no pending transactions to be posted for it. Validation is made based on Notes field, which is populated once adjustment is done by the process.
- Notes field should not be modified in Script nor should be worked upon by any other process.
- All the invalid transactions should be cleared and post to WIP should be finished with no pending records.


Copyright 2023 • Rego Consulting Corporation • Privacy Policy