
|
-
-
 The Adoption Dashboard is designed to enhance data integrity and project tracking within Clarity by providing insights into how well users are populating and managing their project and resource data. Features: · Project Data Quality Evaluate the accuracy of project status reporting, risk, issue tracking, and schedule adherence. · Resource Data Quality Assess how well resource managers are managing timesheets, allocations, and actual utilization. · Adoption Scoring View Rate the consistency of data entry across projects and resources on a scale of 0-5, helping identify areas needing improvement. · Variance Analysis View Track discrepancies in project schedules, effort, budgets, and resource commitments. · Compliance Monitoring Ensure that all necessary project and resource data is up-to-date, aiding in more informed decision-making and better project outcomes.
 -
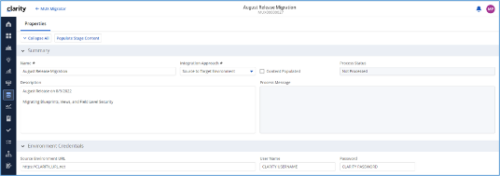
 A tech trick document that assists you in update Data Source when utilizing the Power BI reports found in RegoXchange.
 -
 Learn basic administrative tasks in this basic administration Clarity training, which includes setting up resources, security groups, OBSs, lookups, time reporting periods, fiscal time periods, calendars, jobs, and timeslices. These activities are focused on ongoing support vs. new configuration. Learn how to setup the ModernUX
 -
 Learn advanced administrative development tasks—including Objects and Fields, Object Portlets, Basic Processes, and XOG. In the last portion of this class we will walk through the high level data model within the Clarity database and walk through some basic NSQL portlets. This is a more technical class focusing on basic configurations - designed for non-technical people.
 -
 Review of functional and technical changes to Clarity from version 16.3.1 through 16.4.0. Some previous decks are available if you need to see further back in the versions. You can request them via the Librarian or emailing suport@regoxchange.com.
 -

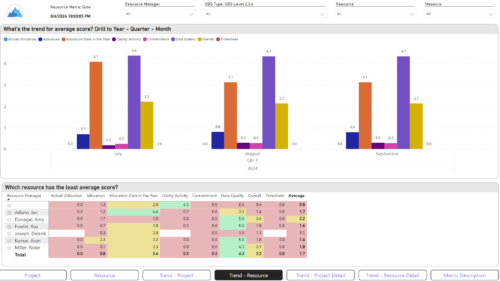
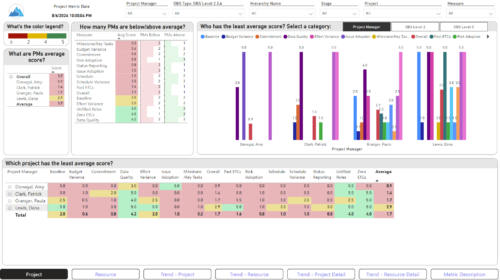
Rego’s Clarity Adoption Metrics package consists of two sets of metrics: Project metrics, and Resource metrics. Project metrics measure how effectively project managers are using Clarity to manage their projects. Resource metrics measure how effectively resource managers are using Clarity to manage resources. Metrics are scored on a scale of 0 to 5, with higher scores indicating greater adoption and use. All metrics can be viewed numerically or graphically, and can be broken out by OBS. In addition, metric data can display as a 12-month rolling history to help identify trends. Project metrics can also display by lowest / highest adoption rates for a specific resource metric or all resource metrics. There is a variety of way to view the Adoption Metric data, therefore, Rego has made this simple by creating an Adoption Metrics object that contains multiple tabs. Each tab displays one or more of the Project or Resource Adoption Metrics. Based on the nature of the Metrics some tabs will allow the ability to use a pull down menu to select a specific Adoption Metric. There is also a Metrics trending view that pulls monthly snapshots of the metrics. Project metrics consist of the following: - Project Status Reporting – Measures how well PMs create and publish project status reports.
- Project Risk Adoption – Measures how well Risks are being used and managed.
- Project Issue Adoption – Measures how well Issues are being used and managed.
- Project Schedule – Measures how well PMs create tasks and keep the project schedule current.
- Project Baseline – Measures whether or not baselines exist.
- Project Zero ETC’s – Measures how well the PM assigns resources to tasks with ETCs.
- Project Past ETC’s – Measures how many improperly scheduled tasks the PM has.
- Project Milestone / Key Tasks – Measures how well PMs create and manage Milestones / Key Tasks.
- Project Schedule Variance – Measures how effectively PMs manage their schedules.
- Project Effort Variance – Measures how effectively PMs manage their project efforts.
- Project Budget Variance – Measures how effectively PMs manage budgets or cost plans.
- Project Unfilled Roles – Measures project roles with allocations that are already started or starting within the next 30 days.
- Project Data Quality – Measures how effectively PMs complete the Description, Stage, Progress, Objective, and Sponsor/Business Owner fields.
- Project Commitment – Measures the hard allocations for a project over a two week time frame.
- Resource Clarity Usage – Measures how often users log into Clarity.
- Resource Timesheet – Measures if timesheets post in a timely manner.
- Resource Allocation – Measures how well RMs keep total resource allocations within the expected range for future time periods.
- Resource Actualy Utilization – Measures how well Resource allocations match actuals.
- Resource Allocation Date in the Past – Measures how many resources are open for time entry with dates in the past.
- Resource Data Quality – Measures how well RMs complete the Resource Manager and Primary Role fields and optionally the Skill and Employment Type fields.
- Resource Commitment – Measures how much resource available time is committed to projects.
-
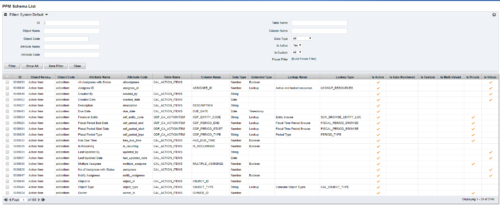 The PPM Data Dictionary Extractor pulls schema and attribute information from each object in CA PPM and places it in a custom object. The following fields provide details information about each attribute in the CA PPM Instance.
- Object Name – The name of the object to which the attribute belongs
- Object Code – The external ID of the object to which the attribute belongs
- Attribute Name – The name of the attribute
- Attribute Code – The external ID of the attribute
- Partition Code – The partition to which the attribute belongs
- Table Name – The database table where the attribute is located
- Column Name – The database column name of the attribute
- Data Type – The data type of the attribute
- Data Size – The character limit of the attribute
- Data Scale – The scale of numeric attributes
- Is Active – Specifies if the attribute is active
- Extended Data Type – The extended type of the attribute (ex: lookup, money, etc.)
- Lookup Name – The name of the attribute’s lookup
- Lookup Type – The external ID of the attribute’s lookup
- Default Value – The default value assigned to the attribute
- API Alias – The REST API alias assigned to the attribute
- Max Value – The maximum value accepted by the attribute
- Min Value – The minimum value accepted by the attribute
- Curve Name – The name of the Curve for Time-Scaled value attributes
- Curve Type – The type of the Curve for Time-Scaled value attributes
- Is Custom – Is the attribute a stock attribute or custom
- Is Auto-Numbered – Is auto-numbering enabled for the attribute
- Is Multi-Valued – Is the attribute a multi-valued lookup
- Is DWH Enabled – Is the attribute enabled for export to the data warehouse
- Is Editable – Is the attribute editable or read-only
- Is Required – Is the attribute required
- Is Virtual – Is the attribute a virtual attribute
- Is Private – Is the attribute a private attribute used by the application behind the scenes
-
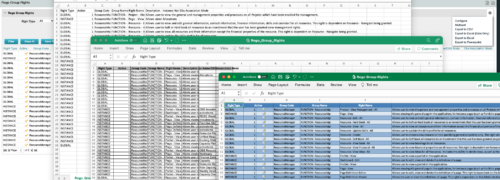
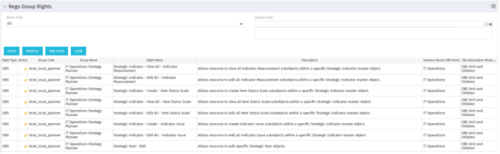 The Rego Group Rights portlet is a useful list view for functional administrators. It provides a flat view of all the Global, OBS and Instance rights that have been granted to all the groups in Clarity. It can be further filtered by just the rights type and/or the security group. It is also possible to export out to file in spreadsheet (csv, xlsx) or PowerPoint formats with OOB Clarity functionality.
 -
 A Quick Reference Guide to assist in the use of Blueprints/Channels to access external sites, applications or Classic PPM in the Modern UX of Clarity. Reviews the configuraton process.
 -
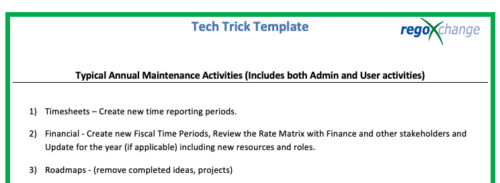 This is a list of 12 typical maintenance items that should be completed for Clarity on an annual basis. There is also a short list of items that should be completed periodically depending on client policies.
 -
 A presentation slide deck from Rego University 2021. This course covered enabling the Modern UX and timesheets, creating a link to the MUX in the classic home menu, creating Blueprints and more.
