-
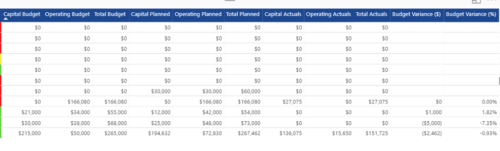
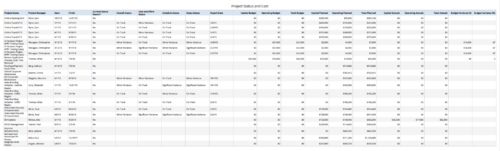 Project Status and Costs report gives the Project Manager a single place to view various Project Statuses ( Cost and Effort, Schedule, Scope and Overall ) and Costs ( Planned, Budget & Actuals ) for multiple projects. User can further narrow their search by OBS Type & Path, Project Name, Project Manager and Is Project Active?.
 -
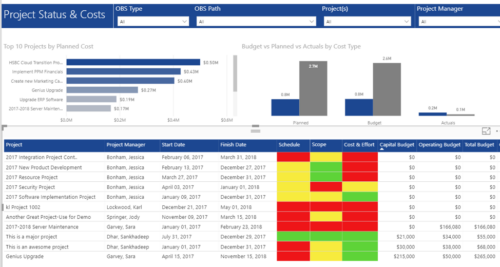 Project Status and Costs report has the details of the Project Schedule, Scope, Cost and Effort Statuses along with Planned, Budget & Actuals costs. There is also graphical representation that shows Top 10 projects by Planned Cost, Budget vs Planned vs Actuals by Cost Type. User can further narrow their search by OBS Type & Path, Project(s) and Project Manager.
 -
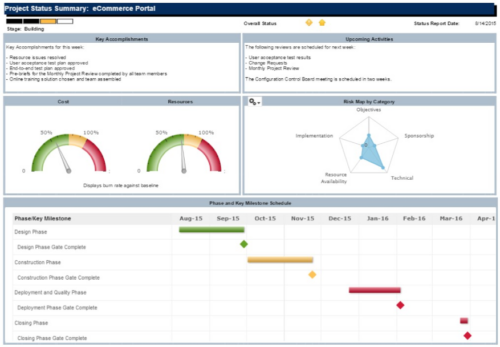 The Project Status Summary report is a transaction based Jaspersoft report that does not require the Load Jaspersoft Datawarehouse job to be run. The report will pull real-time data from the transaction tables in Clarity. This report can be run from either the Advanced Reporting or Reports and Jobs area within Clarity. The Project Status Summary report displays summary information about a project, including current stage, overall status, key accomplishments, upcoming activities, the cost and amount of resources that are consumed, mapped risks indicating categories with a high number of risks, and a high-level Gantt chart displaying information about the project phases and key milestones.
 -
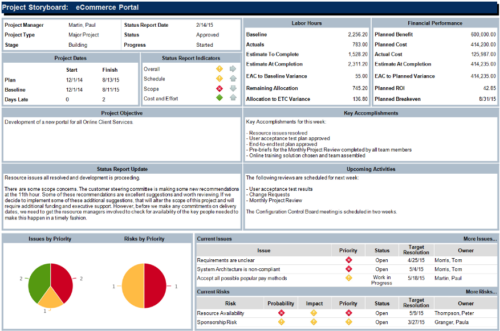 The Project Storyboard report is a transaction based Jaspersoft report that does not require the Load Jaspersoft Datawarehouse job to be run. The report will pull real-time data from the transaction tables in Clarity. This report can be run from either the Advanced Reporting or Reports and Jobs area within Clarity. The Project Storyboard report shows key aspects of a project that is organized in separate frames. Each frame in the report displays project information such as project dates, project objective, the amount, and cost of resources that are planned and actual, key accomplishments, upcoming activities, current issues and risks, and the project progress toward goals. This report can be used to analyze the project earned value and track work performance to account for cost and schedule variances.
 -
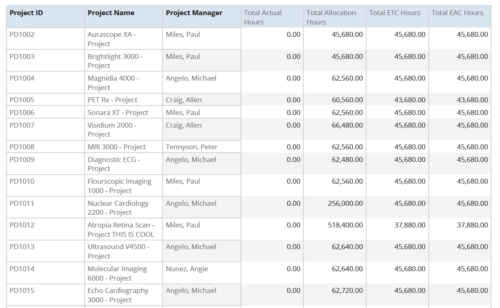 Project Time Summary report provides the project manager a single place to view Actual hours, Allocation hours, ETC hours and EAC hours for all filtered projects. It also displays Project ID, Project Name and Project Manager. User can further narrow their search by OBS Type & Path, Project Name, Project ID, Project Manager, Task Name, Project Status, Project Stage, Project Role, Is Active? and Is Template?.
 -
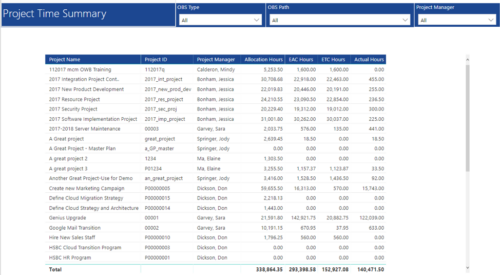 Project Time Summary report provides view of Allocation hours, EAC hours, ETC hours and Actual hours for Projects. User can further narrow their search by OBS Type & Path and Project Manager.
 -
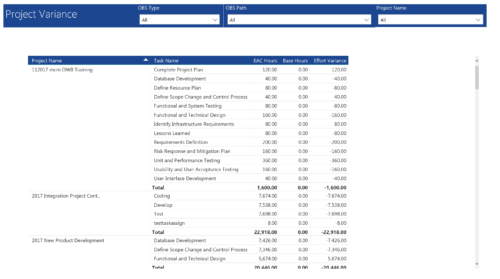 Project Variance report provides project managers a single place to view all their active projects, open tasks, Task EAC hours, Task Baseline hours and their variance. Project Managers can use this report to view and manage their projects progress against their baselines. They can easily detect the projects that are running behind and pinpoint the tasks that are causing the variance in the schedule. You can further narrow your search by OBS Type, OBS Path and Project.
 -
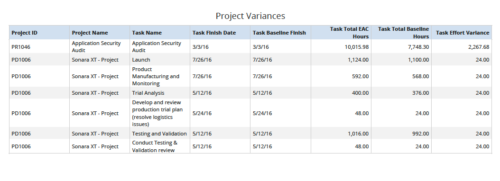 Project Variances is a grid chart that provides project managers a single place to view baseline variance at task level for various projects. This report helps managers analyze how projects are progressing against their baselines and helps them in taking correcting measures if required. You can further narrow your search by OBS Type, OBS Path, Project ID, Task Finish Date, Task Total EAC to Baseline Hours variance, Task Total EAC to Baseline Hours variance%, Task Total Baseline Hours, Task Total EAC Hours and Is Project Active?
 -
 Are you starting a project/financial management implementation, or do you want to compare how you are using these functions vs. others or best practices? In this class we will discuss some best practices from successful customers.
 -
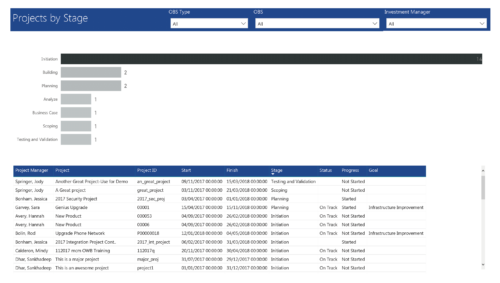 Project by Stage is a bar chart that displays count of projects by out of box Stage attribute. Stage attribute values are plotted on Y axis. Label on the bar chart slice displays the count of projects associated with that respective Stage value. User can further drill down the information to investment level by clicking on particular bar slice. You can further narrow your search by OBS Type & Path, Investment Manager.
 -
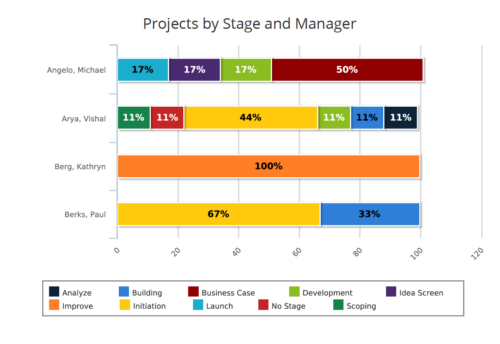 Projects by Stage and Manager report is a stacked bar chart that displays percentage of projects associated with project manager at a particular stage. Legend displays colors used to represent various Project Stages. This report provides to PMO a quick snapshot of where certain projects are sitting with each Project Manager. You can further narrow your search by Project Manager, Project Name, Is Project Active? , Is Template? And Is Program?
 -
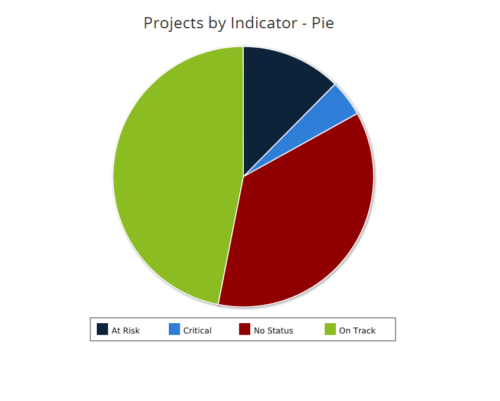 Projects by Status Indicator is a pie chart that displays count of projects by out of box Status Indicator attribute. Legend displays the colors associated with various Status Indicator values. Mouse over the pie chart slice displays the count of projects associated with that respective Status Indicator value. You can further narrow your search by OBS Path, Project Manager and Is Project Active?.


Copyright 2023 • Rego Consulting Corporation • Privacy Policy