-
 Course Description: If I build a process in the Classic UI, does it still get triggered in the Modern UX? If I add a new attribute in the Classic UI, how will it be exposed in the Modern UX? This class will focus on the setup of Clarity PPM's Modern UX. It will include topics like turning on the Modern UX, setting up links, using blueprints, and configuring tiles and objects. We will explain how the Modern UX and the Classic UI interact when it comes to administration.
 -
 Learn about the various techniques and emerging methods companies are taking to capitalize Agile work. You'll learn how some companies are moving away from timesheets and using models based on story points and team rates to generate capitalization reporting.
 -
 Are your reports and portlets performing well? This class will walk through specific SQL tuning tricks to make queries run faster, increase end-user satisfaction, and smooth-out system performance. This is an easy way to promote efficient future development and make a huge, positive impact on user experience.
 -
 Did you stray from OOTB? Was that the right decision? This will be a discussion on pros and cons of sticking to Clarity’s stock attributes, views, and general capabilities. When does it make sense to avoid custom configuration? Conversely, when does it make sense to move beyond the standard OOTB setup?
 -
 What integrations are the most requested and the most utilized? This class will review the most common interfaces to and from Clarity, including best practice use cases and lessons learned from real implementations.
 -
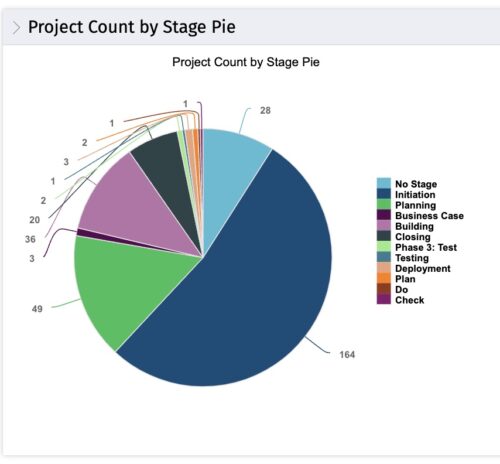 This portlet displays the projects by Stage in a pie chart. Every piece of the pie chart represents a stage of the Project Management methodology applied. The portlet also shows the number of projects on each stage. The legend displays all the different project stages appearing on the portlet. This portlet can be filtered to show only projects from a particular OBS unit or for a particular Project Manager.
 -
 “Resources with No Basic Matrix Entry” portlet displays combinations of project and resource where the assigned resource does or does not have a rate established for that project. Portlet is filterable by Projects, Project ID, Resources, and Missing Rate (Yes, No, All). How does this work? The Rate Matrix Extraction job populates a record into the NBI_PROJ_RES_RATES_AND_COSTS table for every resource/project combination that meets any of the rate matrix criteria. This portlet checks that table, and sets the Missing Rate attribu
 -

 The portlet shows the project spend to vendors by month. The Vendor field picked on the portlet comes from the Vendor mentioned when creating the voucher (as displayed on the first screenshot). This provides a nice view of identifying how much is spent by an organization on the vendor employees on their workforce.
 -
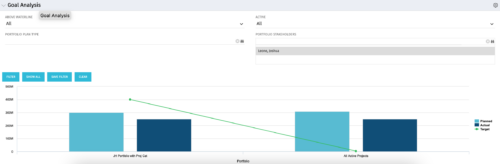
 Part of the Business Transformations collection, this portlet displays planned revenue as defined by a project whose goal is "Grow the business". It uses the Planned Revenue Query as a data provider. This portlet provides a holistic overview of how many projects following the goal “Grow the Business” are Critical/ At Risk / On Track with regard to the planned revenue.
 -
 Part of the Business Transformation collection, this portlet displays count of the planned benefits (savings) per project manager. It also displays if any of the planned benefits are Critical/ At Risk / On Track, along with the total planned benefit amount.
 -
 Part of the Business Transformation collection, this pie chart portlet displays realized benefit, grouped by location of project. This provides the PM with a holistic view of benefits realized across the geographical locations.
 -
 Part of our Business Transformation collection, this portlet relates exclusively to Benefit costs in the Portfolio and its investments. Portlet is a combination of Line Chart and Vertical Bar Charts. It displays data for one or more portfolios depending on rights and filters. Green Line represents Portfolio Target Benefits. Light blue bar represents aggregation of investment Planned Benefits. Dark blue bar represents aggregation of Investment Realized Benefits (actual benefits). Filtering is available for Above or Below Waterline investments OR all portfolio Investments. May also filter on Portfolio values as well as Plan values. Filtering also available for Active vs Inactive Portfolios.


Copyright 2023 • Rego Consulting Corporation • Privacy Policy