-
 Are you looking to extend your investment in Clarity and share it with other stakeholders in your company? We know organizations today are looking for cool collaborative ways to work. Come check out what Clarity has to offer.
 -
 Has your organization made significant investments in technology solutions without seeing precise results? Do you have the right capabilities yet lack an interconnected, end-to-end solution? Come to this session to learn more about the importance of a living strategic roadmap and how Rego's Digital Ecosystem Assessment program can help. This session will review the key elements needed to create an effective roadmap that can drive increased maturity and excitement within your organization, and how that roadmap can help optimize your digital ecosystem.
 -
 Do you have enough experience with the data model to be dangerous - maybe just the basic project and resource tables? This class will take you to the next level in understanding the Clarity data model and provide training on how to write NSQL queries within Clarity for use in your portlets and reports.
 -
 This course will review the benefits of utilizing Rego’s Action Item Responder for a variety of tasks in Clarity. Email responses can be used in many cases to forgo logging into Clarity to carry out tasks.
 -
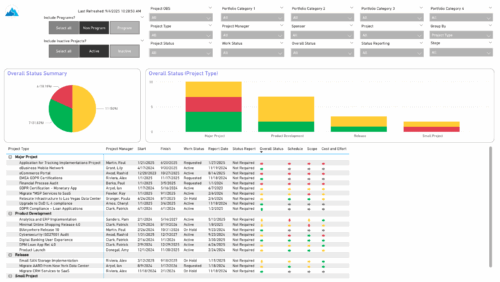 The Project Status Report List provides a consolidated view of project health, including schedule dates, work status, and key status indicators. Users can group results by Portfolio Category, Overall Status, Project Type, Stage, Project Manager, Sponsor, or OBS Level, with the report dynamically adjusting its columns based on the grouping selected. Visuals include an overall status pie chart that shows the percentage of projects by status color, and a column chart that breaks down project counts by status, aligned to the chosen grouping option.
 -
 SPM in Action - a client case study. A current Rego client (Eaton Engineering) will share their SPM journey, including why it was necessary, the technical challenges they faced and how they were addressed, the impact of organizational change, how Rego's expertise and technical assets supported the implementation, and the benefits they're now seeing with their new operating model.
 -
 This class explores the future of AI in project management, highlighting innovative use cases for predictive analytics. Participants will gain insights into emerging AI technologies and gather an understanding of Predictive Analytics and AI.
 -
 This class will discuss how successful Clarity users solve issues, discover solutions, and successfully utilize Clarity. As the tool grows in functionality, learn how you can support the tool and end users. Drive value for your Clarity investment by supporting end users and a technically healthy implementation at the same time.
 -
 Value Stream Management (VSM) isn’t just another buzzword; it’s the visibility layer your digital transformation is starving for. In this session, learn how to map, measure, and maximize value across the entire delivery lifecycle.
 -
 This session dives into the impact of misaligned data between planning and delivery systems—and what it costs your organization in rework, delays, and missed opportunities. Learn how connecting Clarity and Jira enables real-time synchronization between portfolio planning and Agile execution, giving CIOs the visibility, traceability, and confidence to drive outcomes—not just activity.
 -
 Looking to automate some tasks within your Clarity environment? This class will guide you through Clarity's workflow engine, covering instance vs. general processes, start options, action types, pre and post conditions, MUX workflows, and notifications.
 -
 Demystify GEL scripts and learn best practices for GEL script development and maintenance. We'll discuss code formatting, comments, pros and cons of various GEL tags, and any other topics that have been on your mind. With several instructors we can break into smaller groups to ensure we answer all of your specific questions including advanced use cases like notifications, querying the database, etc.


Copyright 2023 • Rego Consulting Corporation • Privacy Policy