-
 ** No Download - Do not Add to Cart ** As Clarity's Modern UX continues to evolve with each release, so has the transition conversation among Clarity Product Owners and Administrators. It's no longer a question of "if" and "when;" the question is, how? In this webinar, we'll explore some best practices that enable a successful shift from Classic to Modern. Through a collaborative discussion of overarching strategies to a step-by-step checklist, this session is designed to help you quickly position your users to take advantage of Clarity's latest and greatest capabilities. Nothing to Download - See Link below. http://info.regoconsulting.com/when-to-move-to-modernux-aug-2020
 -


The Percent Time by Type and Timescale - Grid portlet shows a breakout of time by timescale for resources the logged in user has view rights for using the timeslices. This portlet gives the Clarity user the ability to show the amount of hours spent on a project by week, month, quarter and year. Using this portlet, the Clarity user can get an overview of all hours in a time period or use the filter to search for a specific dataset (as required). The portlet provides a filter for OBS and date ranges. -
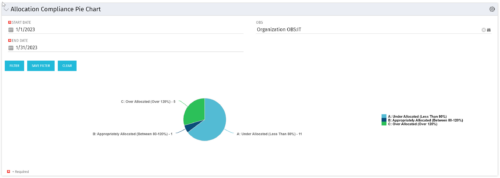 The Allocation Compliance Pie Chart portlet gives a view of active resources' allocation compliance within a date range and OBS displayed in a pie chart. It allows the user to the percentage of resources over, under, and adequately staffed on projects over a selected time period. This portlet leverages the daily allocation and daily availability slices as well as only active investments. The portlet provides filters for specific dates (required) and OBS.
 -
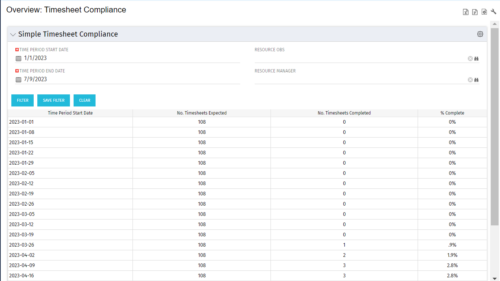 This portlet provides a view into the number of timesheets that were expected to be completed for a specified time period(s) as well as the number of timesheets that were completed and the percent complete. This can also be filtered by OBS so that a company can see timesheet compliance at the OBS level.
 -
 Learn how to create Custom Domains and Dashboards on the fly with Rego's Atul Kunkulol. This is a fun technique to use with your Demand and Capacity. Download is the slide deck file. To view the webinar click here - http://event.on24.com/wcc/r/1219157/B398371FAAAF960D6B26717D66F8011A
 -
 A Quick Reference Guide to assist in the use of the Portfolio Reporting in Clarity’s Classic UX. Reviews the Scorecard in the Portfolio menu, portlet available, and exporting data as reports.
 -
 A Rego training deck that walks through the various aspects of Open Workbench and offers tips and trick on using the tool to manage projects in sync with Clarity. Covers: Opening a plan, Multiple Staffing, Preference Options, Quick Access Toolbar, Quick Search and Quick Filter, Views and Filters, Copying Plans, Work Breakdown Structure, Dependencies, Assignments, Autoschedule, Baselining and Plan Closure.
 -
 This training document is a Rego Consulting Quick Reference Guide to assist with staffing the Idea Team in Clarity’s Modern User Experience.
 -
 This training document is a Rego Consulting Quick Reference Guide to assist resource managers with the adjusting of timesheets. This doc references version 16.0.2 views. Document provides guidance on how to use the Review & Approve tab to adjust time that has already been entered by a resource.
 -
 This training document is a Rego Consulting Quick Reference Guide to assist with the adding of resources to the Staff tab for Ideas in Clarity’s Modern User Experience. This doc references version 16.0.2 views. Document provides detail on how to add resources to the Staff tab, Default Allocation % and Per-Period metrics.
 -
 This training document is a Rego Consulting Quick Reference Guide to assist with creation and management of resource Teams in Clarity’s Modern User Experience. This doc references version 16.0.2 views. Document provides detail on how to create Teams and add resources to a Team. Instructions are provided on how to add resources by OBS and how to allocate a team to an investment. Team key points are provided with regard to Classic, Allocations, ETC and Financials.


Copyright 2023 • Rego Consulting Corporation • Privacy Policy