-
 Part of the Business Transformation Content collection, this bar chart portlet displays count of ideas per business unit. This provides a holistic view of the idea pipe-line in an organization providing them a high-level of ideas converted, approved, unapproved per business unit.
 -
Part of the Business Transformation Content collection, this bar chart portlet displays count of ideas per business unit. This provides a holistic view of the idea pipe-line in an organization providing them a high-level of ideas converted, approved, unapproved per business unit.
-
 Part of the Business Transformation Collection, this bubble-chart portlet displays investments per their alignment, status and total planned benefit. The: X-axis displays the alignment Y-axis displays the status Bubble-size displays the total planned benefit
 -
Part of the Business Transformation Collection, this bubble-chart portlet displays investments per their alignment, status and total planned benefit. The: X-axis displays the alignment Y-axis displays the status Bubble-size displays the total planned benefit
-
Part of the Business Transformation Collection, this bubble-chart portlet displays investments per their alignment, status and total planned benefit. The: X-axis displays the alignment Y-axis displays the status Bubble-size displays the total planned benefit
-
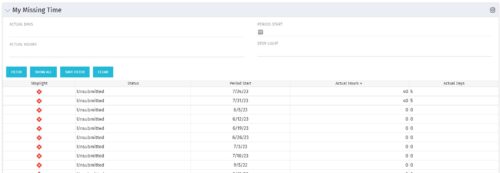 The My Missing Time portlet displays all open time periods for which the logged in user (assuming they are open for time entry with a track mode of Clarity) has a timesheet that is not posted (accommodates for hire and termination dates). The portlet is used as a quick reference for users to view their missing time.
 -
The My Missing Time portlet displays all open time periods for which the logged in user (assuming they are open for time entry with a track mode of Clarity) has a timesheet that is not posted (accommodates for hire and termination dates). The portlet is used as a quick reference for users to view their missing time.
-
 This training document is a Rego Consulting Quick Reference Guide to assist with the process of entering and submitting timesheets in Clarity’s Modern User Experience. The document reviews Accessing and Selecting Timesheets, Population of the Timesheet, and Updating Time & Submitting.
 -
 Are you considering or analyzing PMO value metrics? This class is a working session will cover lessons learned in PMOs, so you can craft guiding metrics, with or without a tool.
 -
 A Quick Reference Guide to assist in entering financial transactions into Clarity’s Classic UX. The guide reviews the basics of transactions entry, create voucher header, entering the line item - details, and entering the line item - transaction.
 -
 Horizontal Bar Graph displays total number of projects for each Business Owner/Sponsor for a selected Project Parent Stage (only Project Investments included). Vertical Axis displays Business Owner name. Horizontal Axis displays number of projects. Filter selectable for any Project Parent Stage. Color coding of bar and legend are synchronized to detail stage under the parent. Total for each detail stage displays on each segment of the bar. A mouseover displays a percent of total for each detail stage.


Copyright 2023 • Rego Consulting Corporation • Privacy Policy