-
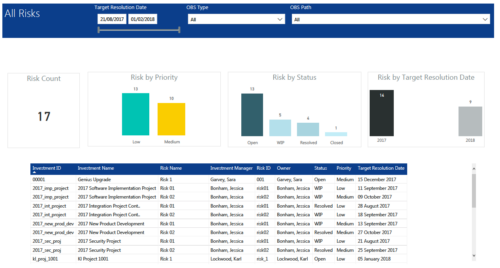 All Risks report provides project managers a single place to view KPIs related to Risks. All the KPIs are depicted in various visualizations. Risk Count: Scorecard that displays the # of Risks for the selected criteria. Risk Priority: Column chart that displays # of Risks by Priority. X axis displays various Risk Priorities. Data labels indicate the number of Risks associated with that category. Risk by Status: Column chart that displays # of Risks by Status. X axis displays various Risk statuses. Data labels indicate the number of Risks associated with that status. Risk by Target Resolution Date: Column chart that displays # of Risks by year of Target Resolution Date. X axis displays Year. Data labels indicate the number of Risks associated with that category. Grid: Displays Risk details such as Investment ID, Investment Name, Investment Manager, Risk ID, Risk Name, Owner, Status, Priority and Target Resolution Date. You can further narrow your search by OBS Type, OBS Path and Target Resolution Date range.
 -
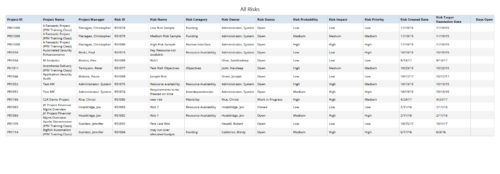 All Risks report provides the project manager a single place to view risks across multiple projects. This report displays Project Information such as ID & Name, Risk Information such as its ID, Category, Owner, Status, Probability, Impact, Priority, Created Date, Target Resolution Date & Days Open. You can further narrow your search by Risk Status, Risk Name, Risk Category, Risk Impact, Risk Priority, Risk Owner, Project Name and Project Manager.
 -
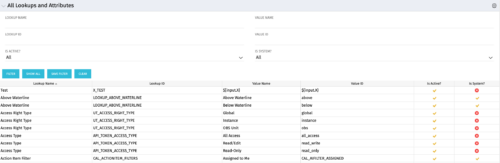 The All Lookups and Attributes portlet provides the ability to see all static lookups in the system, as well as their lookup values. Ability to filter and view the population by lookup name and ID, value name and ID, whether or not the item is active, and whether or not the item is a system (seeded) value. A system value is a record that comes with a base installation of Clarity as opposed to a value that was added manually or through a Clarity Add-in.
 -
The All Lookups and Attributes portlet provides the ability to see all static lookups in the system, as well as their lookup values. Ability to filter and view the population by lookup name and ID, value name and ID, whether or not the item is active, and whether or not the item is a system (seeded) value. A system value is a record that comes with a base installation of Clarity as opposed to a value that was added manually or through a Clarity Add-in.
-
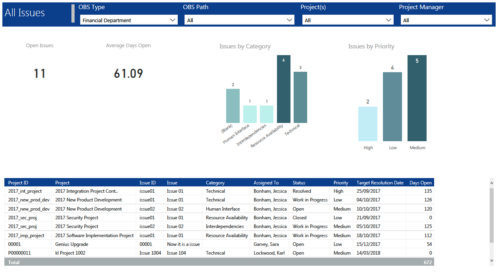 All Issues report provides project managers a single place to view KPIs related to Issues. All the KPIs are depicted in various visualizations. Open Issues: Scorecard that displays the # of Issues that are not closed or resolved. Average Days Open: Scorecard that displays the # of days on an average an issue is in open state. Issue category: Column chart that displays # of Issues by category. X axis displays various Issue categories. Data labels indicate the number of Issues associated with that category. Issue Priority: Column chart that displays # of Issues by priority. X axis displays various Issue priority. Data labels indicate the number of Issues associated with that priority. Grid: Displays Issue details such as Project ID, Project, Issue ID, Issue, Category, Assigned To, Status, Priority, Target Resolution Date and Days Open. You can further narrow your search by OBS Type, OBS Path, Project(s) and Project Manager.
 -
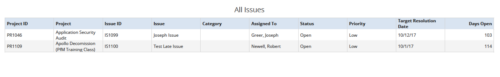 All Issues report provides the Project Managers a single place to view all the Issues across multiple projects. User can view only the projects that he has access to. This report provides Issue information such as ID, Name, Category, Assigned To, Status, Priority, Target Resolution Date and Days Open ( # of days Issue is open ) User can further narrow their search by OBS Type & Path, Issue Name, Project Name, Project ID, Is Project Active?, Issue Owner, Issue Status, Issue Target Resolution Date, Issue Category and Issue Priority.
 -
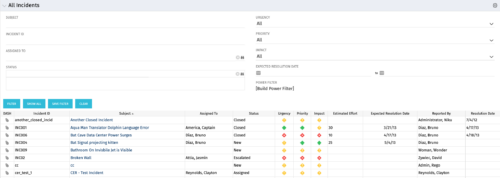 The All Incidents portlet shows all Incidents the user has view rights on and provides a single view to increase ease of management. Status indicators provide a quick overview of incident statuses so a user may prioritize. The filter then allows the user to narrow their search using date ranges and/or resources assigned. Other alternatives for filtering include the status, urgency, priority or impact of the Incident.
 -
The All Incidents portlet shows all Incidents the user has view rights on and provides a single view to increase ease of management. Status indicators provide a quick overview of incident statuses so a user may prioritize. The filter then allows the user to narrow their search using date ranges and/or resources assigned. Other alternatives for filtering include the status, urgency, priority or impact of the Incident.
-
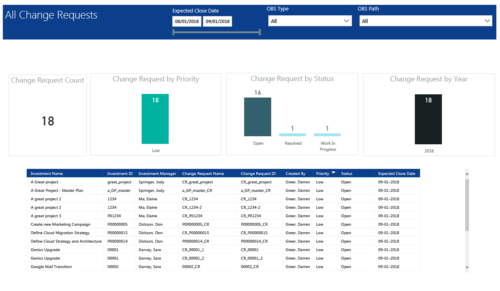 All Change Requests report provides project managers a single place to view KPIs related to Change Requests. All the KPIs are depicted in various visualizations. Change Request Count: Scorecard that displays the # of Change Requests for the selected criteria. Change Request by Priority: Column chart that displays # of Change Request by Priority. X axis displays various Change Request priority. Data labels indicate the number of Change Request associated with that category. Change Request Status: Column chart that displays # of Change Request by Status. X axis displays various Status. Data labels indicate the number of Change Request associated with that Status. Grid: Displays Change Request details such as Investment ID, Investment Name, Investment Manager, Change Request ID, Change Request Name, Status, Priority and Expected Close Date. You can further narrow your search by Expected Close Date Range, OBS Type and OBS Path.
 -
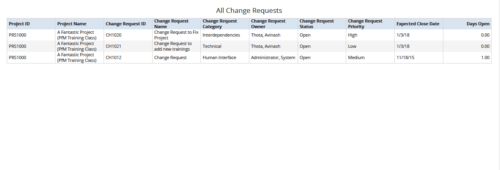 All Change Requests report provides the project manager a single place to view change requests across multiple projects. This report displays Project Information such as ID & Name, Change Request Information such as its ID, Name, Category, Owner, Status, Priority, Expected Close Date and Days Open. You can further narrow your search by OBS Type & Path, Change Request Status, Change Request Name, Change Request Category, Change Request Owner, Project Name and Project Manager.


Copyright 2023 • Rego Consulting Corporation • Privacy Policy