-
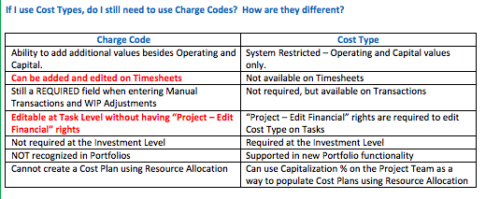 The Cost Type field was introduced in CA PPM 13.3, but had some limitations because it wasn’t available in certain financial areas. The CA PPM 14.3 release includes the addition of Cost Type in the Cost/Rate Matrix, Chargebacks, Transactions and WIP Adjustments. This Technical Trick assists you in moving from Charge Code to Cost Type.
 -
 This portlet pulls back the Availability and Allocation totals by Role between a user-specified Start and Finish Date, then the user can drilldown to look at the information for Applications. The Time Period filter allows for comparing these values across different timeframes (monthly, weekly, quarterly, annual) as desired. Other filters allow for looking at Active or Inactive Roles (or both) and including Active or Inactive Projects (or both) in the totals.
 -
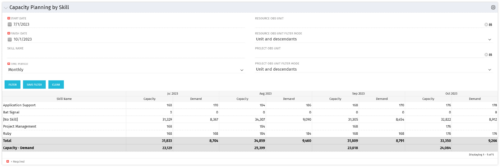 The Capacity Planning by Skill portlet displays the capacity and demand by skill for a selected timeframe. This portlet is used to determine which skills are in high demand, being used efficiently, and how much capacity may be remaining for the time period. The portlet may be filtered by skill name, resource OBS or project OBS to narrow the results.
 -
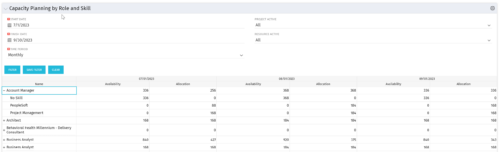 The Capacity Planning by Role and Skill portlet displays all availability and demand in the system summarized by role. The portlet also allows the user to drill-down further into the role and separate the hours by primary skill. This portlet leverages the timeslices, and pulls availability from resources and allocation from the team records. The user is able to narrow the results by filtering on start/finish date, time period, active projects, and active resources. Using this portlet, a resource manager can quickly determine resource needs, skill needs, and overall allocation/availability of roles.
 -
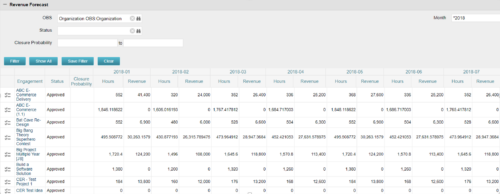
The Revenue Forecast portlet displays projected revenue at a project level broken out by month. This portlet assists in viewing all project revenue data at once and making it easily exportable. The table below describes the available filter fields in the portlet. Column Label Description OBS OBS to filter projects with Status Status of the project Closure Probability ? Months Month(s) of Project Revenue to display -
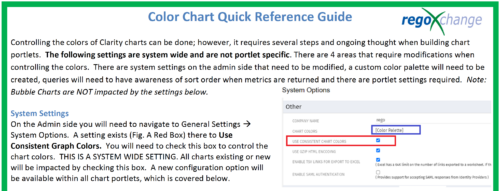 The Using Consistent Colors technical trick shows how management can create a uniform color pallet for all charts within the system. This trick, not only makes charts more professional when delivering to management, but also creates a uniform pattern throughout the Clarity environment.
 -
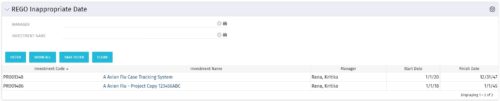 This grid portlet to show projects with finish or start date of project more than 20 years in future or past. The portlet automatically displays results when accessed. The user can apply filters to fetch the desired information.
 -
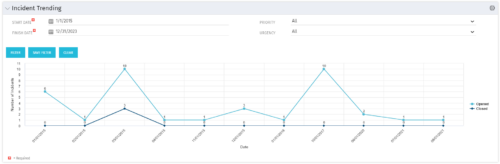 The Incident Trending portlet all opened and closed incidents within a certain time frame. This portlet will show trends in incidents over previous months and allows for analysis of as to the root cause in a spike of incidents. The information may be filtered by date range, urgency and priority.
 -
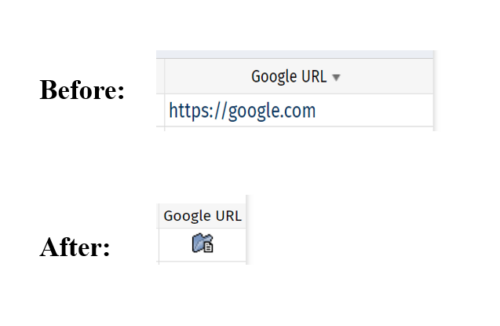 This tech-trick defines how a URL attribute can be changed to an image in a list view via CSS.
 -

 Pie Chart displays projects by Baseline Finish Variance—is current project finish beyond baseline finish; or is current project finish on or before baseline finish. Filterable by OBS structure and Finish Date range. Data labels show percent within baseline vs percent outside baseline. Mouse-over shows Within or Outside label and percent of total projects. Legend shows color coded Within Baseline and Outside Baseline labels. Drilldown: Clicking on a pie slice yields a grid portlet of projects either Within or Outside Baseline.
 -
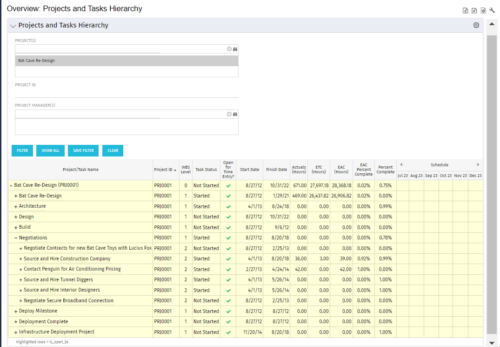 This document provides an overview of how hierarchical portlets can be exported to MS Excel. The code of a sample hierarchical portlet is explained. The included sample portlet shows a list of projects and the tasks under each project along with actual and assignment hours. The portlet can also be filtered by project and project manager.
 -
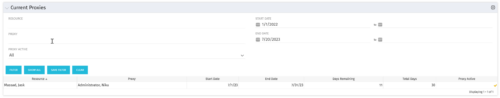 The Current Proxies portlet provides a user with an overview of all the resources in the system currently using a proxy. This portlet is helpful to determine a proxy if a user is currently out of the office. The portlet provides several pieces of information related to the resource including: resource names, proxy, start date, end date, days remaining, total days, and if the proxy is active. The user may filter by resource name, proxy name, proxy status (defaults to Yes), and start/end dates (defaults to the current date).


Copyright 2023 • Rego Consulting Corporation • Privacy Policy