-
 A review of how Northern Trust integrates financial systems with Clarity PPM bilaterally, providing the Finance organization crucial information, and NT Project Managers with a birds-eye view of project financials. Utilizing the Rego Data Extractor and the Rego Data Processor, these information exchanges help Portfolio and Project Managers eliminate their manual and redundant efforts, solidify their overall data accuracy, and dramatically improve the content provided to their Execs for decision-making.
 -
 MITRE will discuss the recent revival of Clarity enabled by an upgrade and elimination of on-premise, non-compliant customizations and their success story. The project leader will address the steps to execute this transformation and the approach taken towards organizational change management.
 -
 By its very nature, the shift to Product Funding is going to require that tracking of that funding. Agile tools do not have much, if any, financial capabilities, so it is important to create an eco-system that can support this value stream—from funding, through delivery, and finally to tracking the realization of financial value. Learn how Rally and Clarity PPM do this very well together.
 -
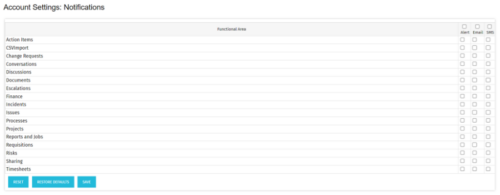 The Turn off Notifications process disables all Email, SMS and Alerts notifications for all users. This process is helpful if users would not like to receive emails from the system regarding actions items, timesheet submissions, etc. The script may be modified to include all users or all users that have been created within the last day.
 -
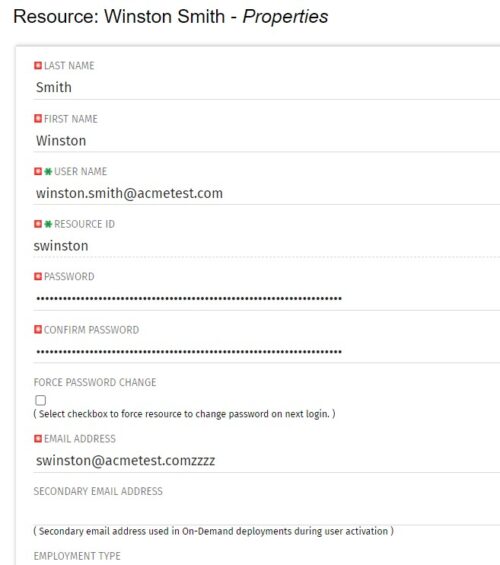 The Update Email Ids workflow sets all users’ email addresses to non-working by appending a “ZZZZ” to the end of the email address. This process is used for when there are refreshes to your Development or Testing environments and do not want emails going to users. When complete, the log will display the total amount of email addresses updated. A second process is included in this workflow that will revert the email addresses to remove the “ZZZZ” added in the first workflow. In some instances, the process may be run in error, or you may want to send emails from a Development or Testing environment; using this second process you will be able to enable all emails again.
 -
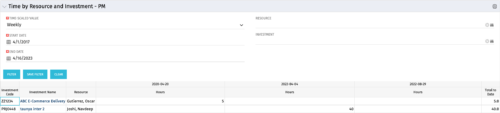 The Time By Resource and Investment - PM portlet shows time spent on projects where the logged in user is the project manager. This portlet is used to get a snapshot of investments and the time that has been put against them at the individual resource level for the projects that user has access to. This portlet is used for determining what resources have put time against specific investments and can be used to see where resources are spending their time or to help rationalize ETCs for remaining work for planning purposes. The portlet may be filtered by time-scale, date, resource or investment to narrow the search results.
 -
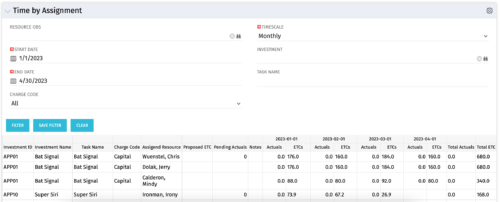 The Time by Assignment portlet displays time logged to assignments for all investments the logged in user has security rights to view - pulling data from the timeslices. It is capable of displaying the data by weekly, monthly or quarterly segments. The portlet may also be filtered by investment and resource OBS.
 -
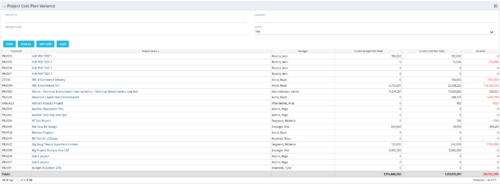 The Project Cost Plan Variance displays the variance between the budget and cost plans for projects the logged in user has security rights to view. The total for the Cost Plan that is marked as the Plan of Record for the project (Current Cost Plan Total), alongside the total for the current approved Budget Plan (Current Budget Plan Total). These two values are then compared in order to generate the total current Variance for the project. A positive amount in the Variance column indicates the project is under budget, while a negative amount indicates the project is over budget. Results may be filtered by: Project ID, Project Name, Manager, and whether the project is Active (Yes, No, All). By default, the portlet will display only Active projects.
 -
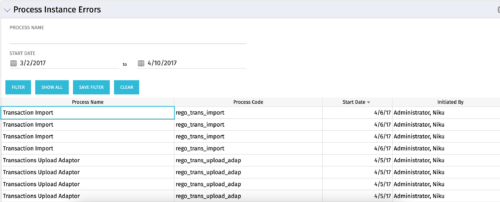 The Process Instance Errors portlet will show all processes that error. This portlet will assist the administrator with determining which processes are in error and whether to skip, retry, or cancel. It will display the process name, code, start date, and who initiated the process. You may also filter by any of the criteria listed in the grid.
 -
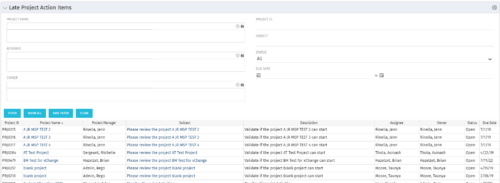 The Late Project Action Items portlet displays all action items related to active projects that the logged in user has view rights to. The action items displayed are those that are past their due date with a status of “In Progress” or “Open”. The portlet provides a Project Manager the ability to view and track action items across multiple projects without going into each project individually. In a single consolidated list, all late project action items can be easily viewed, along with the project with which they are associated, the individual assigned, and the owner of the action item.
 -
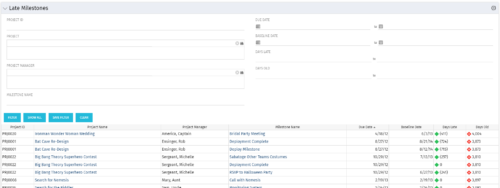 The Late Milestones portlet displays all action items related to active projects that the logged in user has view rights to. The milestones displayed are those that are not closed but are past their finish date or past their baseline finish date. The portlet provides a Project Manager the ability to view and track action items across multiple projects without going into each project individually. This portlet provides a single consolidated view of late milestones based on the current project baseline, and the age of the milestone. The portlet will display the Project ID, Project Name, Project Manager, Milestone Name, Due Date, Baseline Date, Days Late (calculated from baseline dates), and Days Old (calculated from today’s date).
 -
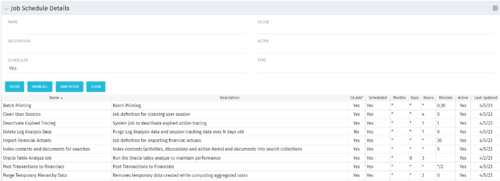 The Job Schedule Details portlet shows al jobs and displays all of the scheduled and non-scheduled information for those jobs – including the months, days, hours, and minutes. It also displays the last time the job was updated and whether or not the job was custom or a CA job. The portlet will help the administrator understand the current job schedule configuration. The table below describes the available columns in the portlet. The first 10 are configured in the default view:
Column Label Description Name Name of the Job Description Description of the Job CA Job? Whether this is CA Job? Yes or No Scheduled Scheduled Status of the Job. Yes or No Months Months the Job is scheduled to run Days Days the Job is scheduled to run Hours Hours the Job is scheduled to run Minutes Minutes the Job is scheduled to run Active Status of Job. Active or Inactive Last Updated Date the Job was Last Updated Code Unique internal Code of the Job Created By Name of Resource who created the Job Date Created Date the Job was created Executable Executable of the Job Job Code Unique Code of the Job Schedule Date Scheduled date of the Job run Type Type Updated By Name of Resource who updated the Job


Copyright 2023 • Rego Consulting Corporation • Privacy Policy