-
 This portlet displays the % allocation of resources to projects. The portlet shows if the resource is allocated to the projects as an individual resource or as part of an Agile team, in which case it will display the resource % allocation to the team and what that will represent in terms of % allocation to the project. The Total Allocation % display the allocation of the resource to all investments is allocated to. Remaining Capacity and Over/Under columns will help identify the resources that still have availability and the ones that are over allocated.
 -
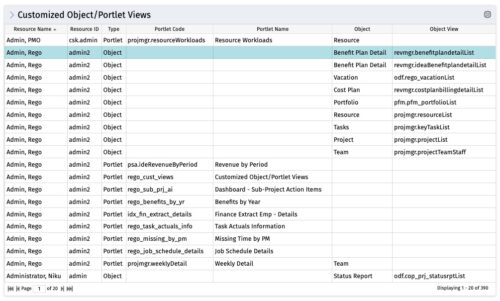 The Customized Object/Portlet Views portlet displays all user edited object/portlet views and the resource(s) that have edited them. This can assist in identifying users who need to be notified prior to publishing view changes. The table below describes the available columns on the object.
Column Label Description Resource Name Name of the resource Resource ID ID of the resource Type Object or Portlet Portlet Code ID of the portlet Portlet Name Name of the portlet Object Associated Object Object View ID of the modified view on the object Object Code Internal code used by the query pkid Internal code used by the query portlet_dbid Database id of the portlet res_dbid Database id of the resource -
 This is a graphic portlet that pulls the average schedule variance by OBS node of the project. The portlet allows you to choose any OBS that is associated to the Project Object. Users can filter by:
- OBS Type
- If the project is financially approved?
- Financial Status
-
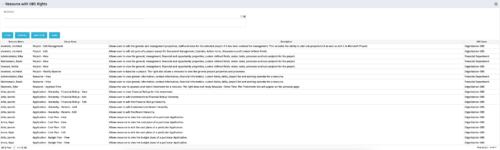 This portlet displays list of resources with OBS rights. This would be helpful for admins to know if a user can perform any actions on object instances of an OBS.
 -
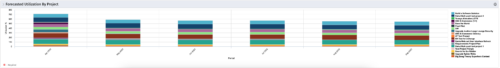 This Portlet produces a Stacked Chart of Projects using total Resource Allocation from each Project’s Team / Staff, per month. Users can specify which Resource OBS to use as a Filter (unit and descendants is assumed) as well as a Start/End Date Range.
 -
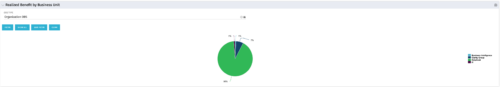 Pie Chart that aggregates Realized Benefit (Total Actual Benefit) by OBS for active projects. Only a Benefit Plan associated with the Cost Plan of Record will return data. The filter allows you to select which OBS filter you prefer to use for this pie chart, however, only an OBS associated with Projects will return data.
 -
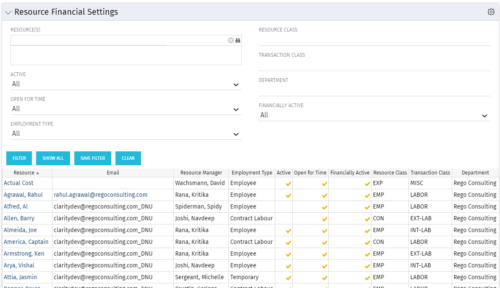 Resource Financial Settings portlet provides resource managers a single place to view financial settings of various resources. It is a grid portlet that displays Resource details such as Name, Email, Manager, Employment Type, Is Active?, Is Open for Time?, Resource Class, Transaction Class and Department. You can further narrow your search by Resource(s), Active, Open for Time, Employment Type, Resource Class, Transaction class and Department.
 -
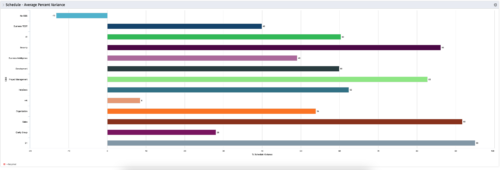
 Bar Chart displays average percent variance for all active projects by OBS unit. Percent variance = Planned Cost - Budgeted Cost / Budgeted Cost * 100. Projects with no Budgeted Cost are ignored for the calculation. Then all project variance percentages are algebraically added (some may be negative), and divided by total projects with a variance. This yields the Average Percent Variance. This calculation is performed for active projects in each OBS unit. OBS units include all units at all levels where projects are attached. Portlet filterable by OBS, Financial Status, and Financially Approved. Vertical axis = OBS Unit Name. Horizontal axis = Variance Percent. Data value = Average Percent Variance. Mouseover value = OBS Name + Average Variance Percent.
 -
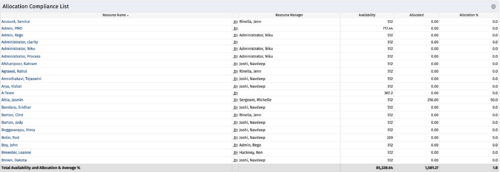
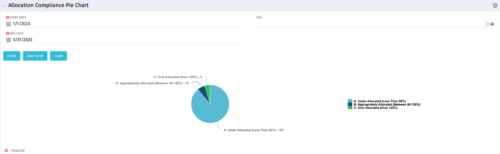
This Allocation Compliance Drilldown Enhancement portlet is used in conjunction with the Allocation Compliance Pie Chart. Once the user selects a specific section of the chart, the Allocation Compliance Drilldown Enhancement will display a list of resources fulfilling that selection. The Allocation Compliance list portlet shows the Resource Name, the Resource Manager, Availability, Allocated Hours and Allocation % for the selection. Note: The Allocation compliance pie chart is displayed first based on the filter selection i.e., Start Date, End Date and OBS. The pie chart is displayed as per the following three slices of the pie: Under Allocated (Less than 80%) Appropriately Allocated (Between 80-120%) Over Allocated (Above 120%) The slice of a pie can be clicked to display resource allocation compliance information in the Allocation Compliance List portlet, as described earlier. The table below describes the available columns in the Allocation Compliance list portlet. The first 5 are configured in the default view: Column Label Description Resource Name Name of the Resource Resource Manager Resource Manager Availability Resource Availability Allocated Resource Allocation Allocation % Resource Allocation % Res_id Unique identifier of the Resource -
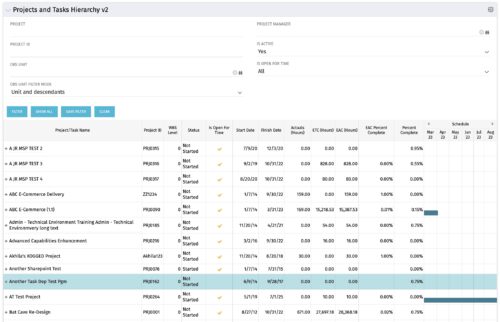 Grid Portlet displays project and task data--including name, dates, status, effort, %Complete, and schedule. Portlet initially displays project data. But there is a + sign toggle, which, when clicked, reveals task data, and the toggle becomes a – sign. User can choose to Automatically Expand all levels from Options Icon>Configure>List Column Section>Options. Portlet supports up to 10 levels of WBS. Portlet filterable by project name and ID, OBS structure, manager name, active/inactive, and open for time entry.
 -
Grid Portlet displays project and task data--including name, dates, status, effort, %Complete, and schedule. Portlet initially displays project data. But there is a + sign toggle, which, when clicked, reveals task data, and the toggle becomes a – sign. User can choose to Automatically Expand all levels from Options Icon>Configure>List Column Section>Options. Portlet supports up to 10 levels of WBS. Portlet filterable by project name and ID, OBS structure, manager name, active/inactive, and open for time entry.
-
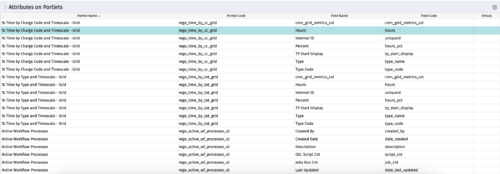
The portlet - Attributes on Portlets - details all attributes on every portlet in the system, whether the person viewing the list has rights to the returned portlets. The table below describes the available columns in the portlet. Column Label Description Portlet Name Name of the portlet Portlet Code ID of the portlet Field Name Name of the attribute Field Code ID of the attribute Virtual Is the attribute virtual or not id Internal code used by the query


Copyright 2023 • Rego Consulting Corporation • Privacy Policy