-
 Ideas by Business Unit report is a pie chart that displays count of ideas per business unit. This report gives a holistic view of the idea pipeline in an Organization and provides information on number of ideas converted, approved & unapproved per business unit. You can further narrow your search by Idea Status, Ideas Start Date and Is Idea Active?.
 -
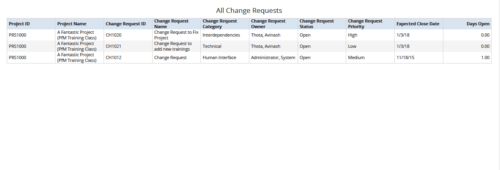 All Change Requests report provides the project manager a single place to view change requests across multiple projects. This report displays Project Information such as ID & Name, Change Request Information such as its ID, Name, Category, Owner, Status, Priority, Expected Close Date and Days Open. You can further narrow your search by OBS Type & Path, Change Request Status, Change Request Name, Change Request Category, Change Request Owner, Project Name and Project Manager.
 -
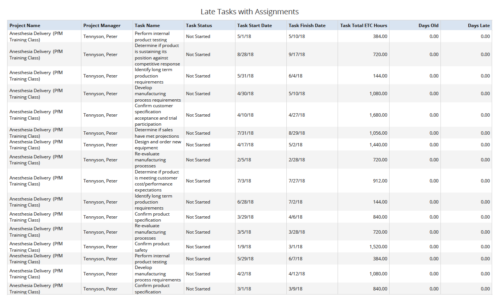 Late Tasks with Assignments report displays the list of all Tasks (with their Total ETC Hours) that are not closed but are past their finish date or past their baseline finish date. The report provides Project Manager the ability to view and track late tasks across multiple projects without going into each project individually. This report displays Project Name, Project Manager, Task Name, Task Status, Task Start Date, Task Finish Date, Days Old (Elapsed days between Task Finish Date and Today's Date), Days Late (Elapsed days between Task Finish date and Task Baseline Finish date). User can further narrow their search by Task Name, Task Status, Project ID, Project Name, Project Manager, Is Milestone?, Is late?, Task Start Date, Task Finish Date and Is Template?. User can use exact dates or relative dates for Task Start Date and Task Finish Date filter parameters.
 -
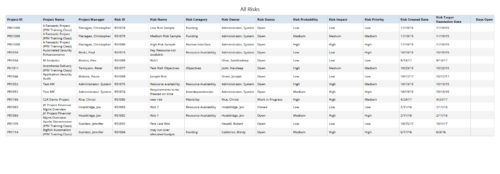 All Risks report provides the project manager a single place to view risks across multiple projects. This report displays Project Information such as ID & Name, Risk Information such as its ID, Category, Owner, Status, Probability, Impact, Priority, Created Date, Target Resolution Date & Days Open. You can further narrow your search by Risk Status, Risk Name, Risk Category, Risk Impact, Risk Priority, Risk Owner, Project Name and Project Manager.
 -
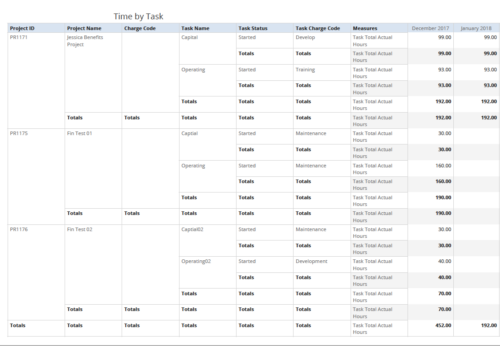 Time by Task report displays monthly time logged to Tasks for all filtered investments. It also displays total Actual hours associated with a task. User can further narrow their search by OBS Type & Path, Charge Code, Project Name, Task Name, Task Charge Code, Task Status and Month End Date. User can use exact dates or relative dates for Month End Date filter parameters.
 -
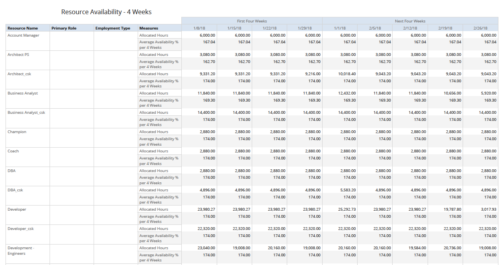 Resource Availability – 4 Weeks displays all resources with their total allocated hours by week, and an average availability percent (4 Wk Avail %) for next four weeks. This report also displays Resource Primary Role and Employment Type. User can further narrow their search by Resource Name, Resource Type & Week Start Date. User can use exact dates or relative dates for Week Start Date filter parameters.
 -
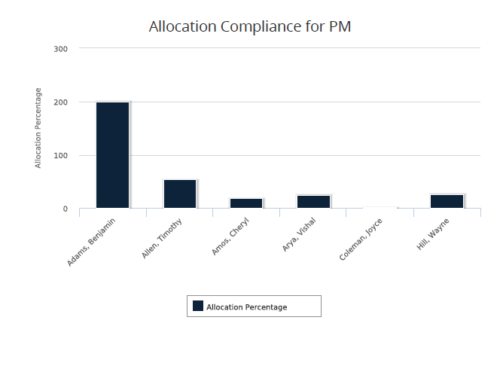 Allocation Compliance for PM report gives a view of resource Allocation percentage for active resources on the team of an investment for a selected Investment Manager. It allows the PM to see resources on their project over the coming months and whether they are over or under allocated. Allocation Percentage is calculated as (‘Allocated Hours’ / ‘Available Hours’) * 100. User can further narrow their search Month Start Date and Investment Manager. User can use exact dates or relative dates for Month Start Date filter parameter.
 -
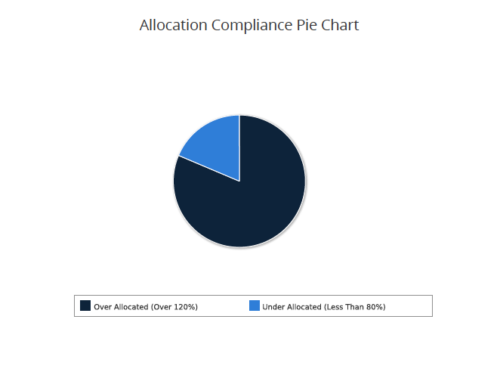 Allocation Compliance Pie Chart provides the resource manager a single place to view the Allocation compliance information in the form of a Pie chart. Allocation Compliance is calculated based on the value of 'Availability to Allocation Hours %'. Allocation Compliance is 'Under Allocated (Less Than 80%)' WHEN 'Availability to Allocation Hours %’ is less than 80. Allocation Compliance is 'Appropriately Allocated (Between 80-120%)' WHEN 'Availability to Allocation Hours %' is between 80 and 120. Allocation Compliance is 'Over Allocated (Over 120%)' WHEN 'Availability to Allocation Hours %' is greater than 120. User can further narrow their search by Resource Is Active?, OBS Type, OBS Path, Allocation Start Date, Investment Name and Resource Manager. User can use exact dates or relative dates for Allocation Start Date filter parameter.
 -
 Learn the basics of creating Jaspersoft studio reports. This session will walk through basic features and introduce report development utilizing the basic report capabilities of Jaspersoft Studio such as Text Fields, Frames, Static Text, Breaks, Lines and Common Page Information Components, Grouping/Sorting, Status Indicators, Dynamic Images, Input Controls, and Basic Charting.
 -
 Course description: “Already have a base understanding of Jaspersoft Studio development? This session will include advanced topics like: duplicating and modifying an OOTB report, Multiple Datasets, Subreports, Charting, Widgets integration, and Crosstabs.” Download file is the presentation slide deck.
 -
 Course description: “Learn how to take advantage of the dashboard reporting capabilities of Jaspersoft, which comes embedded in CA PPM 14.2 and later. This class is designed to provide hands on exercises to teach individuals how to utilize the power of this Excelius-like capability. Leveraging the advanced UI features of dashboards, CA PPM perception will increase, giving executives the views they want.” Download file is the presentation slide deck.
 -
 Course description: “Learn how to take advantage of the ad-hoc reporting capabilities of Jaspersoft, which comes embedded in CA PPM 14.2 and later. This class is designed to provide hands on exercises to teach individuals how to utilize the power of this new product. As users begin building their own reports and dashboards, the burden on developers will decrease and CA PPM perception and adoption will increase.” Download file is the presentation slide deck.


Copyright 2023 • Rego Consulting Corporation • Privacy Policy