-
 This training document is a Rego Consulting Quick Reference Guide to assist with the creation of Cost Plans in Clarity’s Modern User Experience. The document reviews navigation to the Financial Module, the Cost Plan sub-page and creating the plan.
 -
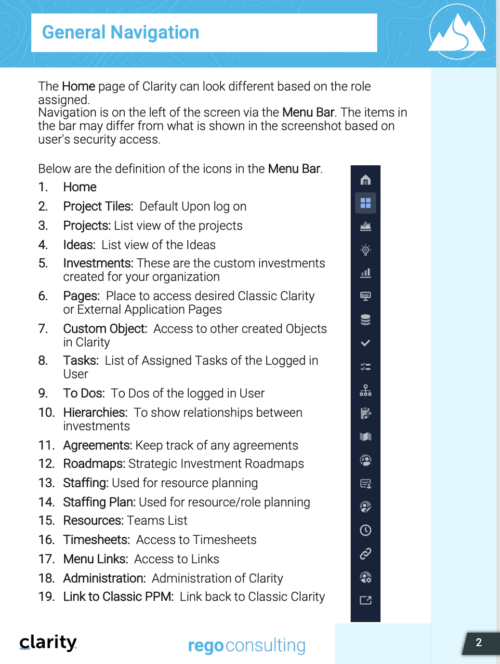
 This training document is a Rego Consulting Quick Reference Guide to assist with General Navigation in Clarity’s Modern User Experience. This doc references version 16.0 views. Doc reviews the Menu Bar and User Tool Bar.
 -
 A slide deck used in Rego’s training classed for Project Management in the Modern User Experience. Reviews terms and definitions, the OBS, Work Breakdown Structure, Templates, Roles and Responsibilities, Allocation vs ETC, Accessing Projects, Project Creation, Staffing, Tasks, Assignments, To Dos, Project Financials, and more.
 -
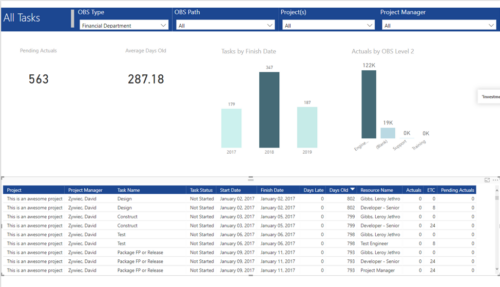 All Tasks report provides project managers a single place to view KPIs related to Tasks. All the KPIs are depicted in various visualizations. Pending Actuals: Scorecard that displays the # of Actuals that are still open and not yet posted. Average Days Old: Scorecard that displays the average number of Task Days Old. Days Old is the difference between Task Finish date and Today’s Date (when Today’s Date > Task Finish date. In other cases, it is zero) Tasks by Finish Date: Column chart that displays # of Tasks by Year of Finish date. X axis display Calendar years. Data labels indicate the number of Tasks finish date within that year. Actuals by OBS level 2: Column chart that displays sum of Task Actuals by OBS level 2. X axis display OBS level2. Data labels indicate the Actuals within that OBS level2. Grid: Displays Risk details such as Project Name, Project Manager, Task Name, Task Status, Start Date, Finish Date, Days Late, Days Old, Actuals, ETC and Pending Actuals Days Late is the difference between Task Finish date and Baseline Finish Date (when Baseline Finish Date > Task Finish date. In other cases, it is zero) You can further narrow your search by OBS Type, OBS Path, Project(s) and Project Manager.
 -
 Are you leveraging Clarity's Roadmaps to support some of the best and most common practices found across industries? Come to this session to learn how Roadmaps work out of the box. We will cover how to configure views, targets, widgets, boards and more! You will leave with great ideas you can bring back to your organization!
 -
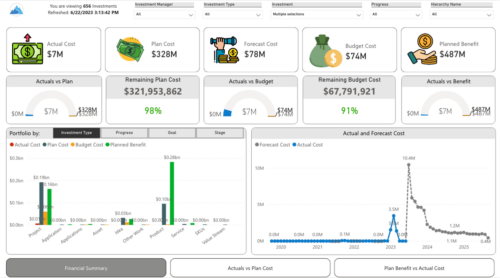
 Gain a financial view of your investments by comparing actuals to planned cost and planned benefit. Report views include: • Financial Summary • Planned Benefit vs Actual Cost • Actuals vs Planned Costs Demo Video - https://www.youtube.com/watch?v=uyDSbbgG1O8&list=PLXJ5ktuWV0jiS9CvBpHvBIwpKPmA9uvwK&index=2
 -
 The portlet is a browser XOG client in the form of an HTML portlet. The purpose is to read/write data from/to Clarity. To write the data, the user needs to have Project – Approve OR Project - Approve - All access right.
 -
 This training document is a Rego Consulting Quick Reference Guide to assist with the process of entering and submitting timesheets in Clarity’s Modern User Experience. The document reviews Accessing and Selecting Timesheets, Population of the Timesheet, and Updating Time & Submitting.
 -
 ** No Download - Do not Add to Cart** - Register for the White Paper at this link - http://info.regoconsulting.com/clarity-roadmaps-fastest-route-to-success Anyone who’s taken a road trip knows the value of a good map. It tells you where you’re going, how long it might take to get there, and where you are at any given time. Your organization’s strategic journey is no different. Whether it’s your corporate strategy or individual investments, you’re heading into territory that could include all kinds of intersections, delays, and detours that could impact your plan. A good roadmap will give you the critical information you need to ensure a smooth journey. In this white paper, we discuss how using Clarity's Roadmap feature will get you pointed in the right direction for success.
 -
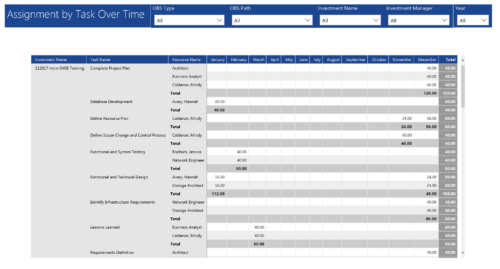 Assignments by Task Over Time report display all assignments by task for all resources. Information is displayed on monthly basis. This report displays Investment Name, Task Name, Resource Name and its monthly assignments. You can further narrow your search by OBS Type & Path, Investment Manager, Investment Name, and Year
 -
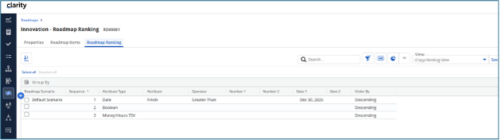
 The Rego Roadmap Ranking provides the ability to rank Roadmap Items within individual Roadmap Scenarios. The function allows the user to define a hierarchical sequence to defined attributes to create a set of rules to generate an auto-ranking, by scenario. Large sets of ranking rules increase complexity and variability, so choose initial rules carefully. When the rank order is configured, a process is actioned that auto-ranks the Roadmap Items for the selected Roadmap Scenario. The Roadmap Ranking can be viewed through the Timeline, Board, or Grid View.
 -
This training document is a Rego Consulting Quick Reference Guide to assist with Allocations Timeline in Clarity’s Modern User Experience. This doc reviews the Investment Timeline and the Resource Histogram sections of the Allocations Timeline.


Copyright 2023 • Rego Consulting Corporation • Privacy Policy