-
 A presentation slide deck from Rego University 2021. This course covered Project Tables, OBS, Timeslices, and Methods to find DB objects.
 -
 Have you experimented with the modern UX channels, links and new page functionality? Our technical experts have unlocked these capabilities to allow you to be creative in what you can do within the modern UX. Come and learn how in this session.
 -
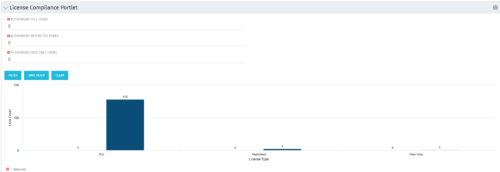 Portlet to quickly show License Compliance for all license types. Simply Enter your License Limits in the filter – The portlet will display the three license types in a grid format with compliance chart and RYG Icons.
 -
Portlet to quickly show License Compliance for all license types. Simply Enter your License Limits in the filter – The portlet will display the three license types in a grid format with compliance chart and RYG Icons.
-
 Do you want to understand the OOTB configuration and functionality of financial management? In this class, we will review the OOTB objects, views, views, and functions of financial plans, rates, and other related areas. We will cover both classic and new UX highlighting differences.
 -
 Do you need to increase user adoption? Participate in this interactive discussion on the best practices for energizing your user base and increasing Clarity value perception.
 -
 This training document is a Rego Consulting Quick Reference Guide to assist with the updating, synchronizing and deleting of Roadmap investments in Clarity’s Modern User Experience. This doc references version 16.1 views. Detail is provided on how to update individual Roadmap items within the Grid View, Timeline View and Board View. Included are instructions on how to synchronize Roadmap investments and how to delete an investment from a Roadmap.
 -
 A presentation slide deck from Rego University 2022. The course outline for creation of Power BI Dashboards for Clarity, Beginner Level.
- Overview
- Connecting to Data Sources
- Reports and Dashboards
- Creating a Report
- Data Import Options
- Data Transformation
-
 A presentation slide deck from Rego University 2022. This document reviews best practices for Demand Management.
- Define Demand for your organization
- Support the Planning business process directly in Clarity
- Think through the process to standardize forms and required data – from capturing the data to leveraging it in views, Roadmaps, Hierarchies and/or reports
- Identify and engage Users and Consumers
- Keep it simple: Understand expected business outcomes when defining required fields, and eliminate everything that isn’t necessary
-
 A presentation slide deck from Rego University 2022. The document reviews the best practices around annual planning for your Clarity instance.
- Introduction
- Annual Planning Basics
- Clarity in Annual Planning
- Investment Tracking
- Resource Planning
- Financial Tracking
- Prioritization
-
 A presentation slide deck from Rego University 2022. The document reviews the process to follow post tool implementation.
- Typical Post-Implementation / Operational Challenges
- Aspirations for and Outcomes of a High Performing Ownership Team
- Model Solution:
- Roles and Responsibilities
- Intake, Triage, and Delivery Process
- Clarity Board-Based Solution
-
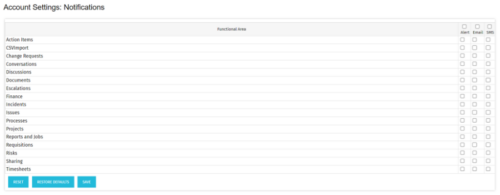 The Turn off Notifications process disables all Email, SMS and Alerts notifications for all users. This process is helpful if users would not like to receive emails from the system regarding actions items, timesheet submissions, etc. The script may be modified to include all users or all users that have been created within the last day.


Copyright 2023 • Rego Consulting Corporation • Privacy Policy