-
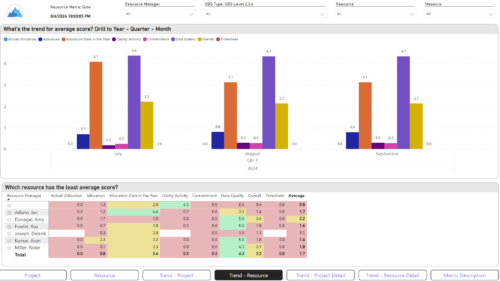
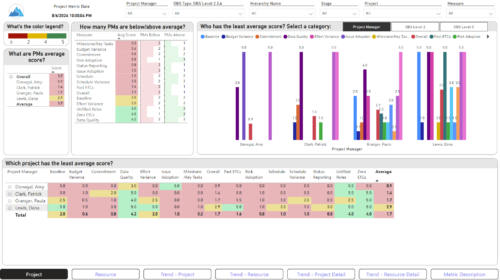 The Adoption Dashboard is designed to enhance data integrity and project tracking within Clarity by providing insights into how well users are populating and managing their project and resource data. Features: · Project Data Quality Evaluate the accuracy of project status reporting, risk, issue tracking, and schedule adherence. · Resource Data Quality Assess how well resource managers are managing timesheets, allocations, and actual utilization. · Adoption Scoring View Rate the consistency of data entry across projects and resources on a scale of 0-5, helping identify areas needing improvement. · Variance Analysis View Track discrepancies in project schedules, effort, budgets, and resource commitments. · Compliance Monitoring Ensure that all necessary project and resource data is up-to-date, aiding in more informed decision-making and better project outcomes.
 -
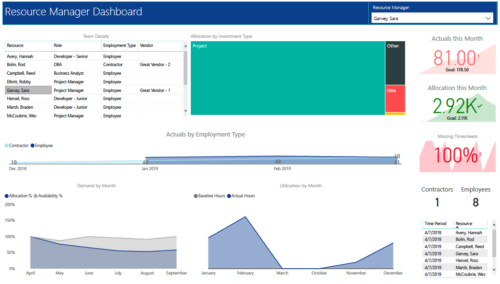 RM Dashboard shows various KPIs like Actuals posted by the resources in last month, Allocation in current month, count of missed timesheets etc. Team Details – Grid report providing list of all the resources managed by a resource manager. Allocation by Investment type – Tree graph displaying distribution pattern of allocation hours across different investment types. Actuals by Employment Type - Area graph, displaying actual hours posted by Employees Vs Contractors. Demand by Month – Area graph, displaying Allocation Vs Availability for next 6 months. Utilization by Month - Area graph, displaying Baseline Vs Actuals hours over last 6 months.
 -
 A tech trick document that assists you in update Data Source when utilizing the Power BI reports found in RegoXchange.
 -
 Learn basic administrative tasks in this basic administration Clarity training, which includes setting up resources, security groups, OBSs, lookups, time reporting periods, fiscal time periods, calendars, jobs, and timeslices. These activities are focused on ongoing support vs. new configuration. Learn how to setup the ModernUX
 -
 Hierarchies and Roadmaps are two powerful capabilities that Clarity has brought to the market. While they work great independently, have you experimented with how they can work together, even better? In this session, come and learn how these two capabilities can complement each other by working in concert giving you both planning and execution insights!
 -
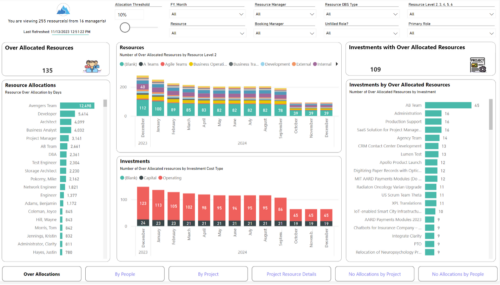 Evaluate resource allocations, identify bottlenecks, and ensure optimal resource utilization across projects and teams. Report Views include: • Over Allocation • By Project • By People • Project Resource Details • No Allocations by Project • No Allocations by People The main file will access data through custom queries created via Rego Odata connector.
 -
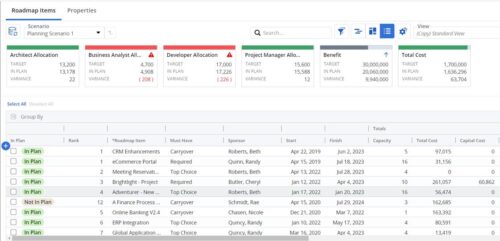 This Roadmap add-on provides configurable Role-based metrics that can be used in the grid view as targets and constraints. Select your valuable roles in the “targets” and once selected, the “sync” button will bring in any current allocations against projects and allow editing any of the total numbers directly in a scenario. This will provide deeper insights into impacts of plans on teams/resources in addition to the out of the box money and time constraints.
 -
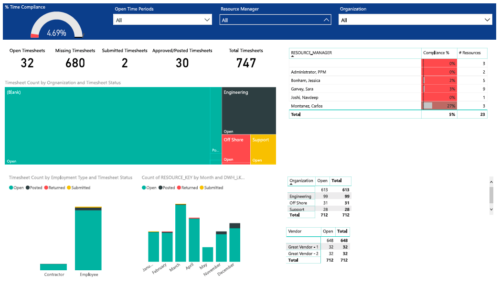 Timesheet compliance is a dashboard containing multiple visualizations that shows timesheet compliance data under various scenarios. Dashboard shows count of timesheets grouped by Status and total available timesheets. % Time Compliance – Gauge graph that shows percentage of completed timesheets against overall timesheets. Compliance by Resource Manager – Grid section that shows percent timesheet compliance by resource manager. Timesheet count by Employment type and Timesheet Status – Stacked column chart, each column represents Employment type and sections of the column represent count of timesheets by Status. Count of Timesheets by Months – Stacked column chart, each column represents a month and sections of the column represent count of timesheets by Status. Dashboard also const of two grid sections displaying number of Open timesheets by Organization and Vendor.
 -
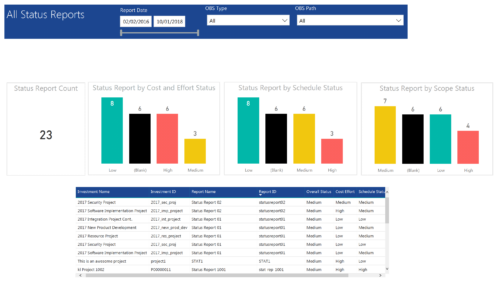 All Status report provides project managers a single place to view KPIs related to Status Reports. All the KPIs are depicted in various visualizations. Status Report Count: Scorecard that displays the # of Status Reports for the selected criteria. Status Report by Cost Effort Status: Column chart that displays # of Status Reports by Cost Effort. X axis displays various Cost Effort Status. Data labels indicate the number of Status Reports associated with that category. Status Report by Schedule Status: Column chart that displays # of Status Reports by Schedule Status. X axis displays various Schedule statuses. Data labels indicate the number of Status Reports associated with that status. Status Report by Scope Status: Column chart that displays # of Status Reports by Scope Status. X axis displays various Scope statuses. Data labels indicate the number of Status Reports associated with that status. Grid: Displays Status Report details such as Investment ID, Investment Name, Report Name, Report ID, Overall Status, Cost Effort, Schedule Status and Scope Status. You can further narrow your search by OBS Type, OBS Path and Report Date range
 -
 Learn advanced administrative development tasks—including Objects and Fields, Object Portlets, Basic Processes, and XOG. In the last portion of this class we will walk through the high level data model within the Clarity database and walk through some basic NSQL portlets. This is a more technical class focusing on basic configurations - designed for non-technical people.
 -
 This training document is a Rego Consulting Quick Reference Guide to assist with accessing the various project views in Clarity’s Modern User Experience. Reviews the Tile, Grid and Board views for projects.
 -
 A Rego Training deck that reviews the use of Hierarchies in Clarity PPM’s Modern UX.
- Hierarchies in Clarity PPM can be used to create one or more hierarchies that define relationships between various investments. Each hierarchy includes an investment tress card made up of multiple cards.
- A parent-child relationship between investment cards help stakeholders understand the dynamics of the investments. Stakeholders can use the Hierarchies page to view all the hierarchies in the organization.
- Hierarchies can include different investment types such as; ideas, projects, and custom investments with configurable cards by investment type.
- Hierarchies can display rolled up aggregation metrics.
- Hierarchies can be exported to PDF.


Copyright 2023 • Rego Consulting Corporation • Privacy Policy