
A presentation slide deck from Rego University 2022. This document reviews the best practices for resource management in Clarity.
|
-

-
 This session will align you with some of the best and most common practices for using Clarity's Resource Management capabilities. Come and learn about the capabilities that come out of the box for resource insights like allocations, assignments, availability and more. Additionally, tips and tricks will be discussed leaving you with a toolkit of ideas for your organization!
 -
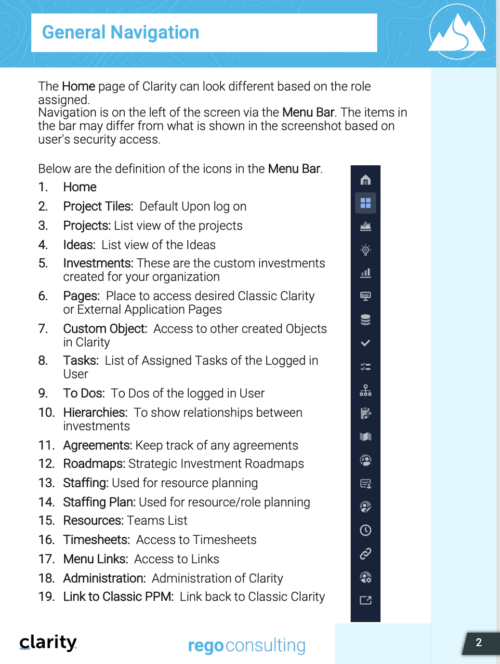
 This training document is a Rego Consulting Quick Reference Guide to assist with General Navigation in Clarity’s Modern User Experience. This doc references version 16.0 views. Doc reviews the Menu Bar and User Tool Bar.
 -
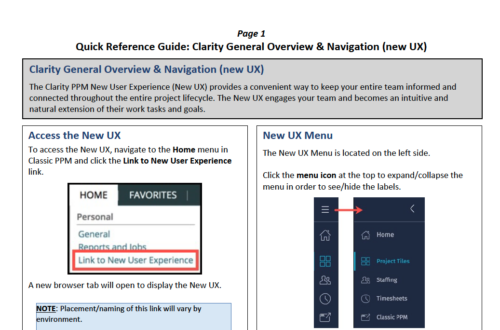 The Clarity PPM New User Experience (New UX) provides a convenient way to keep your entire team informed and connected throughout the entire project lifecycle. The New UX engages your team and becomes an intuitive and natural extension of their work tasks and goals.
 -
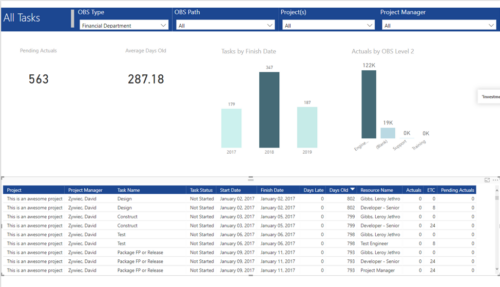 All Tasks report provides project managers a single place to view KPIs related to Tasks. All the KPIs are depicted in various visualizations. Pending Actuals: Scorecard that displays the # of Actuals that are still open and not yet posted. Average Days Old: Scorecard that displays the average number of Task Days Old. Days Old is the difference between Task Finish date and Today’s Date (when Today’s Date > Task Finish date. In other cases, it is zero) Tasks by Finish Date: Column chart that displays # of Tasks by Year of Finish date. X axis display Calendar years. Data labels indicate the number of Tasks finish date within that year. Actuals by OBS level 2: Column chart that displays sum of Task Actuals by OBS level 2. X axis display OBS level2. Data labels indicate the Actuals within that OBS level2. Grid: Displays Risk details such as Project Name, Project Manager, Task Name, Task Status, Start Date, Finish Date, Days Late, Days Old, Actuals, ETC and Pending Actuals Days Late is the difference between Task Finish date and Baseline Finish Date (when Baseline Finish Date > Task Finish date. In other cases, it is zero) You can further narrow your search by OBS Type, OBS Path, Project(s) and Project Manager.
 -
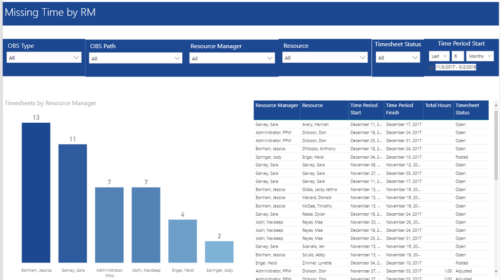 Missing Time by RM report displays Resources whose timesheets are missed by Resource Manager. There is Clustered Column Chart which displays missed timesheets count by Resource Manager. Also, there is table view of Resource Manager, Resource, Time Period Start and Finish Dates, Total Hours and Timesheet status. User can narrow their search by OBS Type & Path, Resource Manager, Resource, Timesheet Status and Time Period Start Date (Relative or Specific Date Range).
 -
 Are you leveraging Clarity's Roadmaps to support some of the best and most common practices found across industries? Come to this session to learn how Roadmaps work out of the box. We will cover how to configure views, targets, widgets, boards and more! You will leave with great ideas you can bring back to your organization!
 -
The Rego Roadmap Conversion process provides the ability to create investments, from Roadmap Items. - Create a roadmap and populate it with Roadmap Item(s). It is useful to create a custom view which contains the attributes needed in the project, or Custom Investment, to be created.
- Create a view to be used to help with the Conversion process. It should include: -
- Roadmap Item: This will become the Investment Name
- Convert to: The type of investment to be created.
- Conversion - Use Template: The template to use in the conversion process.
- Sync Status: The status of the conversion process
- Sync Message: additional details for the conversion process
- In addition, check the Scenario that is selected.
- In the Properties > Actions menu select Convert to Investment
- This will initiate the conversion process and will select the roadmap items that: -
- have no linked to set.
- have both the Convert to and Conversion Use Template selected.
- If any of these details are empty the roadmap item will be ignored.
- The Sync Status and Sync Message will be updated to show whether the conversion has completed successfully, or not.
- The Linked to will be populated with the newly created investment.
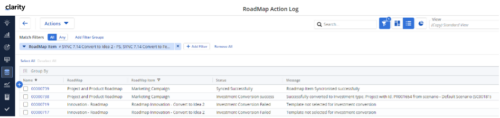
- There is a Roadmap Action Log which can be accessed via Custom Objects. This is useful for administrators and tracks all actions undertaken by the Conversion Process. A history of the conversions completed, and their sync status and messages can be accessed from here.
-
 A Quick Reference Guide to assist in configuring the layout of Ideas and Custom Investments in Clarity’s Modern UX via Blueprints. Reviews the configuration process including changes to Details and Modules.
 -
 A slide deck used in Rego’s training classed for Project Management in the Modern User Experience. Reviews terms and definitions, the OBS, Work Breakdown Structure, Templates, Roles and Responsibilities, Allocation vs ETC, Accessing Projects, Project Creation, Staffing, Tasks, Assignments, To Dos, Project Financials, and more.
 -
 Project Manager- Resource/Compliance report provides project managers a single place to view Compliance status for various critical KPIs. All the KPIs are depicted in various visualizations.
- Unfilled Demand: Donut chart that gives you the count of roles (within projects) that are not filled by resources.
- # Of New team members: Scorecard that displays the count of new team members added to the projects.
- Resource Constraints: Donut chart that gives you the count of Over utilized and underutilized resources
- Unsubmitted Time: Dial gauge that displays the count of resources that did not submit time.
- Stale Tasks: Dial gauge that displays the count of tasks that are past their due date
- Status Report Compliance: Dial gauge that displays the compliance of status reports for various projects.
-
 “Real” Resource management is not for the faint of heart. To get a solid picture of the actual capacity multiple dimensions have to be considered: projects, daily business, absences, different work hours and more. In this session we will demonstrate how this can be done with the help of “Advanced Resource Planning” in Clarity. We will staff projects in seconds, simulate different options, jog new projects in and finally simulate the resource aspect of whole Roadmaps.
