-

 This training document is a Rego Consulting Quick Reference Guide to assist resource managers with the approval of timesheets via the Review & Approve tab. This doc references version 16.3 views. Doc reviews accessing and selecting timesheets, reviewing submitted timesheets, approving timesheets, approving multiple timesheets, returning timesheets and the timesheet grid.
 -
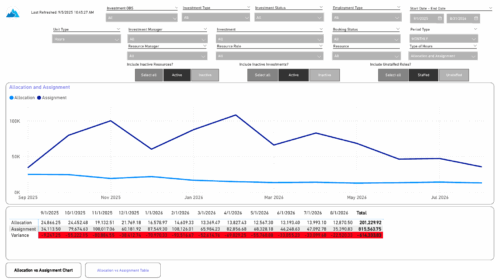 The Investment Allocations and Assignments report provides visibility into team member allocation, task assignment, and variance amounts by investment across time periods. A chart highlights allocation compared to assignment amounts by period. Results can be displayed by week, month, or in total, and viewed in either hours or FTEs for each team member and investment. Interactive visuals make it easy to compare planned effort against actual assignments at the team member and investment level. Content Type: Business Intelligence, PowerBI Report
 -
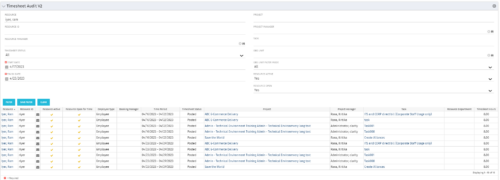 The Timesheet Audit portlet displays timesheet information in order to perform an audit. The only required data needed to search the portlet is start and finish date. Additionally, you may narrow the results by filtering by resource, resource ID, OBS Unit, resource manager, timesheet status, project, and task. The portlet provides reporting on the following:
- Resource
- Resource ID
- Email Icon of Resource (So the reviewer can quickly email the Resource)
- Resource is Active
- Resource Open for Time
- Time Period (Start and Finish Dates)
- Timesheet Status
- Is Adjustment (If the timesheet is adjusted)
- Timesheet Modified Date
- Timesheet Posted Date
- Timesheet Submitted By
- Timesheet Approved By
- Project
- Task
- Proposed ETC Hours
- Pending Actual Hours
- Total Actual Hours
-
 This training document is a Rego Consulting Quick Reference Guide to assist with Entering and Submitting Time in Clarity’s Modern User Experience. This doc references version 16.3 views. Document includes Accessing & Selecting Timesheets, Populate Timesheet, Updating Timesheet, Submitting Timesheet and Entering Time for Someone Else.
 -
 The Enhanced Time Tracking Stalker – RM workflow process automatically sends a single email to Resource Managers which contains a list of any of their resources that have not submitted their timesheet for a prior open time period. The email informs the RM if their resources are submitting their timesheets on time. The email includes a table that provides this information for each resource: Resource Name, Time Period, Timesheet Status and Total Hours saved on the timesheet with links to the timesheet in the Modern User Experience of Clarity. These notifications will help to ensure that time is being posted and approved in a timely manner.
 -
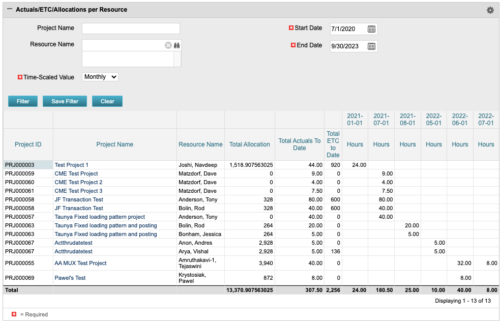 The portlet displays posted time by project for the logged in user based on time period and date range. This allows the user to see at a glance their ETC and actuals on the projects. The portlet displays the Total Allocation and Total Actuals to Date for the user on the projects they are allocated/assigned to. The actuals are displayed per month in the form of TSVs.
 -
 This training document is a Rego Consulting Quick Reference Guide to assist resource managers with the adjusting of timesheets. This doc references version 16.3 views. Document provides guidance on how to use the Review & Approve tab to adjust time that has already been entered by a resource.
 -
 This training document is a Rego Consulting Quick Reference Guide to assist with Time Entry Administration Settings for Timesheets. This doc references version 16.3 views. Document provides detail on Timesheet Options for the Modern UX and how to enable end user column configuration. Detail is also provided on how end users may configure their timesheet view.
 -
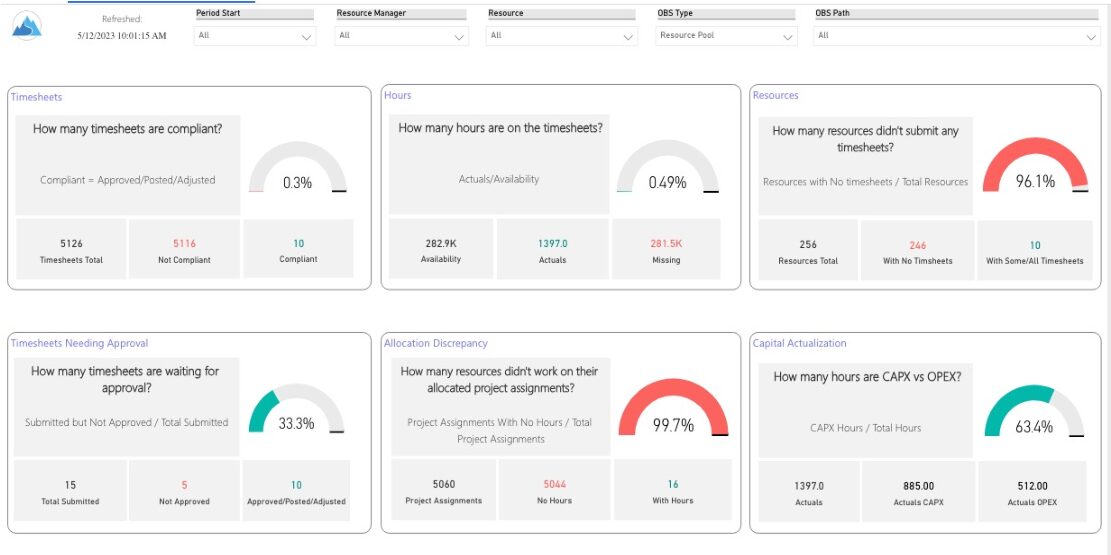 Spot opportunities to improve timesheet accuracy and resource allocations by assessing timesheet compliance and allocation. Report Views include: • Allocation Variance • Capex vs Opex • Hours Detail • Resource Dtails • Single Manager Drill Down • Single Resource Drill Down • Timesheet Detail • Timesheet Summary • Unapproved Timesheets Demo Video: https://www.youtube.com/watch?v=yxIkkqSyrRU&list=PLXJ5ktuWV0jiS9CvBpHvBIwpKPmA9uvwK&index=8
 -
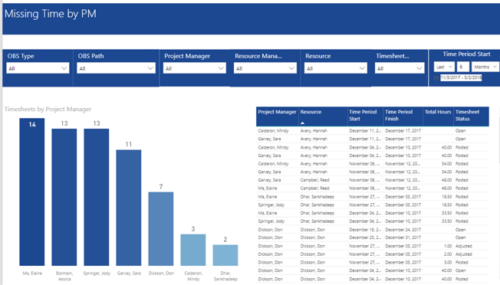 Missing Time by PM report displays Resources whose timesheets are missed by Project Manager. There is Clustered Column Chart which displays missed timesheets count by Project Manager. Also, there is table view of Project Manager, Resource, Time Period Start and Finish Dates, Total Hours and Timesheet status. User can narrow their search by OBS Type & Path and Project Manager, Resource Manager, Resource, Timesheet Status and Time Period Start Date (Relative or Specific Date Range).
 -
 You are no longer regulated to the desktop browser to respond to action items. Learn how Rego solved this problem using just your email. We’ll talk about various use cases where you would get maximum benefit from a simple response on an action item directly from your email. It doesn’t matter if you are using email on your desktop, laptop, phone or tablet. The Action Item Responder as you covered.
 -
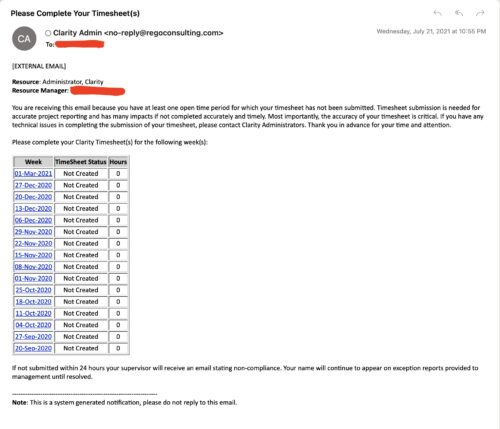
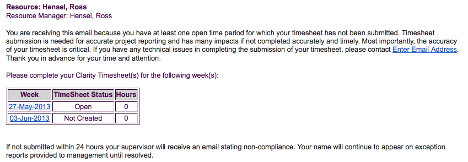 The Enhanced Time Tracking Stalker – Resource workflow process is used to notify resources who failed to submit a timesheet for the prior time period they must take action. The workflow checks for active resources (by using the hire and termination dates, their track mode and that they are open for time entry). Each resource who meet the criteria receives an email asking them to submit their outstanding timesheet(s). The email includes a table that contains this information: time period, timesheet status and any hours currently saved on the timesheet. All outstanding timesheets are included in the table with links to the timesheet in the Modern User Experience side of Clarity. This process helps to ensure the timely submission of timesheets.


Copyright 2023 • Rego Consulting Corporation • Privacy Policy