
28 results
-
 The Capacity Graph - Investment portlet displays Availability, Allocations, Assignments and Actuals for active resources in a single project. This portlet pulls from timeslices and allows the user to filter on weekly, monthly, or quarterly data. This portlet provides a Project Manager with a simple way to analyse: Allocations vs. Actuals and Allocations vs. ETC. Depending on metric goals, the graph allows the user to determine where areas of improvement may exist.
 -
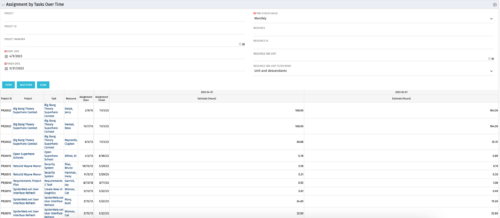 The Assignments by Task Over Time portlet displays all assignments by task for all resources using the timeslices. This portlet is useful for determining which tasks a user is assigned to or how many hours the user is assigned to a task. The user may filter on certain criteria that include: project name/ID, date range, resource name/ID, and resource OBS unit.
 -
The Assignments by Task Over Time portlet displays all assignments by task for all resources using the timeslices. This portlet is useful for determining which tasks a user is assigned to or how many hours the user is assigned to a task. The user may filter on certain criteria that include: project name/ID, date range, resource name/ID, and resource OBS unit.
-
The Assignments by Task Over Time portlet displays all assignments by task for all resources using the timeslices. This portlet is useful for determining which tasks a user is assigned to or how many hours the user is assigned to a task. The user may filter on certain criteria that include: project name/ID, date range, resource name/ID, and resource OBS unit.
