-
 This session dives into the impact of misaligned data between planning and delivery systems—and what it costs your organization in rework, delays, and missed opportunities. Learn how connecting Clarity and Jira enables real-time synchronization between portfolio planning and Agile execution, giving CIOs the visibility, traceability, and confidence to drive outcomes—not just activity.
 -
 This training document is a Rego Consulting Quick Reference Guide to assist with the use of Sub-Objects and Channels in Clarity’s Modern UX.
 -
 Course Description: Have you ever thought of using Clarity PPM for surveys or quality audits? Would you like to create dashboards with metrics from surveys, lessons learned, project audits, and quality? In this class, we will review a customer use case where all of this was done in Clarity PPM—linking to SharePoint to capture survey results, then producing dashboards inside of PPM and SharePoint based on very specific metrics.
 -
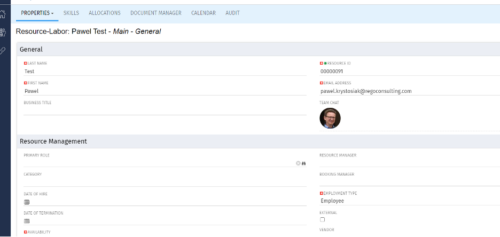
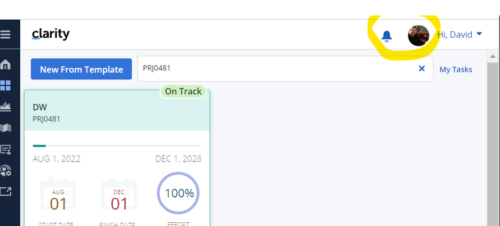 Connect with user and get familiar with them via Office 365/Azure Profile photos synced with the Clarity PPM Avatars. This is a good way to collaborate with the team and users for any quick update or interaction. This is a scheduled process in Clarity named Sync Profile Photo from Office 365 and will be scheduled to run as a job. When the process is executed, it will be setting the Microsoft O365 profile photo into the users Avatar photo in Clarity PPM and optionally, sync custom attribute of the Resource with profile photo, which can be used for quick identification of the user. Sync Process come with some parameters for the Support team, which they can use as per there environment configurations. These some important Gel parameters for quick configuration are:
- msProfilePicField : Custom Resource Field to store Photo, if not provided process will skip syncing the custom field.
- msTenantId: Microsoft Azure Tenant Id
- msClientId: Microsoft Azure Application client Id
- msClientSecret: Microsoft Azure Application client Secret
- msTeamPhotoSize: Define size of the photo to be fetched
- syncPPMAvatar: Parameter to Sync PPM User Avatar photo from MS Team
-
 This training document is a Rego Consulting Quick Reference Guide to assist with managing Task Assignments in Clarity’s Modern User Experience. The document covers creating new assignments and updating ETC.
 -
 A Quick Reference Guide to assist with Task Assignments in Clarity. The document shows screen shots from the Classic UX with the Phoenix theme.
 -
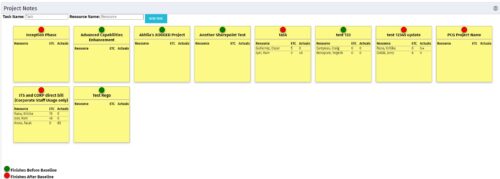 The Task-At-A-Glance Notes portlet provides a view of project tasks and assignments in an easy to read format, similar to popular sticky – note applications. This portlet will display all tasks on a project, ‘pinning’ them to a dashboard. Each task will include the resources assigned to them, as well as the ETCs left for the resource, and the actuals that they have posted. Each sticky note allows you to link to the task details, as well as the resource assignment details. In addition to important assignment detail, each pin on the individual task’s note indicates if the task finishes before the baseline (green), or if it is going to finish after the baseline (red).
 -
The Task-At-A-Glance Notes portlet provides a view of project tasks and assignments in an easy to read format, similar to popular sticky – note applications. This portlet will display all tasks on a project, ‘pinning’ them to a dashboard. Each task will include the resources assigned to them, as well as the ETCs left for the resource, and the actuals that they have posted. Each sticky note allows you to link to the task details, as well as the resource assignment details. In addition to important assignment detail, each pin on the individual task’s note indicates if the task finishes before the baseline (green), or if it is going to finish after the baseline (red).
-
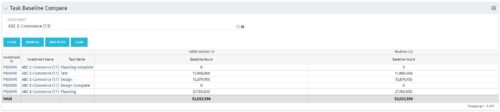 The Task Baseline Compare portlet displays the tasks in a specific Investment and provides the ability to compare the baseline hours for the tasks in each version of the baseline.
 -
The Task Baseline Compare portlet displays the tasks in a specific Investment and provides the ability to compare the baseline hours for the tasks in each version of the baseline.
-
The Task Baseline Compare portlet displays the tasks in a specific Investment and provides the ability to compare the baseline hours for the tasks in each version of the baseline.
-
 When a task is marked as complete the process looks to any tasks that are dependent on the newly completed task. If a task is marked as “Not Started” and all of the dependency tasks are marked as complete then the process will change the task status to “Started” and email all resources that are assigned to the task that has started. The process notifies resources that a task is ready to start and saves the project manager the manual effort of updating dependent tasks. NOTE: The process relies on task dependencies and is most useful in those environments where task dependencies are managed.


Copyright 2023 • Rego Consulting Corporation • Privacy Policy