-
 This training document is a Rego Consulting Quick Reference Guide to assist with the population of project properties in Clarity’s Modern User Experience. Documents starts with accessing the project via the Tile module. Then shows how to update properties in the Details page and in the Project List.
 -
 This training document is a Rego Consulting Quick Reference Guide to assist with use of the Task List Tab to manage project tasks in Clarity’s Modern User Experience. Document reviews the Task List Tab, and the Task Tab Sub Tabs.
 -
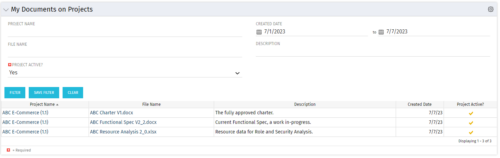 This Portlet allows users to quickly access Documents they uploaded into Projects via the Classic UI à Collaboration tab or via the New UX Documents module. Clicking on the File Name downloads the file, clicking on the Options gear allows users to export the list to Excel.
 -
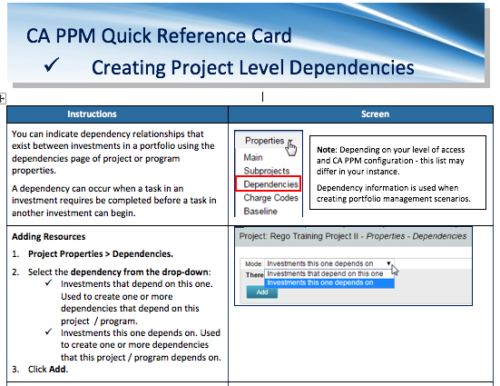 A Quick Reference Card to assist in the creation of project level dependencies. You can create dependency relationships that exist between investments in a portfolio using the dependencies page of project or program properties. A dependency can occur when a task in an investment requires to be completed before a task in another investment can begin.
 -
 Course description: “How are other companies storing or managing documents? This session will discuss options for using native CA PPM, linking to SharePoint, connecting directly to SharePoint, using Google docs, as well as other options. This session will also discuss options for document approval workflows within CA PPM for both collaborative documents and attachment fields.” Download file is the slide deck used during the presentation.
 -
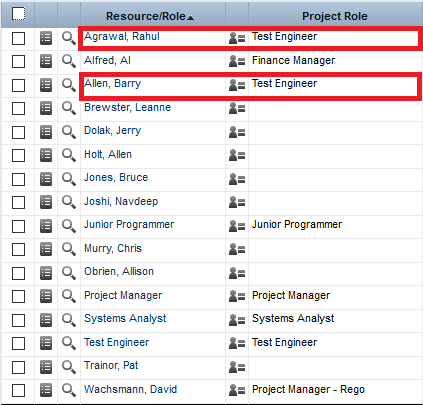
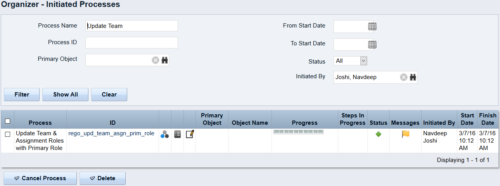 This process updates the team, assignment and timesheet roles with the primary role where they do not match. This way, the PM can push all roles to team and assignment for that project before they do a cost plan.
 -
 Are you struggling with implementing Agile tools in your organization in addition to Clarity? This class will review best practices for implementing agile tools in conjunction with Clarity - living in a Bi-Modal world. We will discuss how Clarity can be used to govern both types of work and teams and how Agile tools should interface into Clarity.
 -
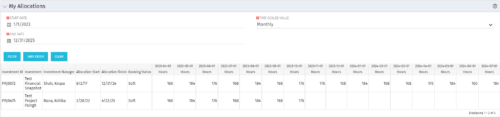 The My Allocations portlet will display the allocations for the logged in user - pulling data from the timeslices. It is used as a quick reference for the users to view their allocations across all of the projects where their allocation is greater than 0 for the specified date range the user wants. This will display both active and inactive projects.
 -

 The Capacity Graph portlet displays Availability, Allocations, Actuals and Assignments for one or more active resource(s) in a single view. This portlet pulls data from timeslices, and allows the user to filter on a weekly, monthly or quarterly data. The Estimated Time to Complete (ETC) and Allocation data will only show for projects that are active. This portlet provides Resource Managers, PMOs and Executives with a simple way to analyse: Allocations vs. Availability, Allocations vs. Actuals, Allocations vs. ETC and ETC vs. Availability. The graph allows the user to determine where areas of improvement may exist and quickly identify potential areas of constraint. Note: the information displayed is dependent on what the user has security rights to view.
 -
The Capacity Graph portlet displays Availability, Allocations, Actuals and Assignments for one or more active resource(s) in a single view. This portlet pulls data from timeslices, and allows the user to filter on a weekly, monthly or quarterly data. The Estimated Time to Complete (ETC) and Allocation data will only show for projects that are active. This portlet provides Resource Managers, PMOs and Executives with a simple way to analyse: Allocations vs. Availability, Allocations vs. Actuals, Allocations vs. ETC and ETC vs. Availability. The graph allows the user to determine where areas of improvement may exist and quickly identify potential areas of constraint. Note: the information displayed is dependent on what the user has security rights to view.
-
 This session will align you with best practices for using Clarity's project management functionality. Come and learn about the OOTB capabilities for excellent project management, including: scheduling, assignments, staffing, views, financial plans, and other general project management capabilities. Additionally, tips and tricks will be shared, providing you with a toolkit of ideas for your organization!
 -
 This training document is a Rego Consulting Quick Reference Guide to assist with the staffing of a Team on an investment in Clarity’s Modern User Experience. This doc references version 16.2.1 views. Doc covers Common Terms, setting up a Default Allocation, Allocation vs ETC, Staff Tab, and Staffing the Team – Time Scale.


Copyright 2023 • Rego Consulting Corporation • Privacy Policy