-
 The Move Role to Team/Assignment process takes the role from the resource object and pushes that information into the team and assignment objects when the role is NULL on the team and assignment objects. This happens normally, assuming a resource has their primary role populated. This process is needed if a resource or set of resources were added to projects without having their primary role filled in.
 -
The Move Role to Team/Assignment process takes the role from the resource object and pushes that information into the team and assignment objects when the role is NULL on the team and assignment objects. This happens normally, assuming a resource has their primary role populated. This process is needed if a resource or set of resources were added to projects without having their primary role filled in.
-
 The Grant Team Project Edit Rights workflow allows a project manager to grant Project – Edit Management rights to all users staffed on the project. This workflow saves not only the project manager time by allowing all users on the project to update information, but also saves the administrator time from granting each resource these rights individually. The process will also remove any rights from members that have been removed from the project.
 -
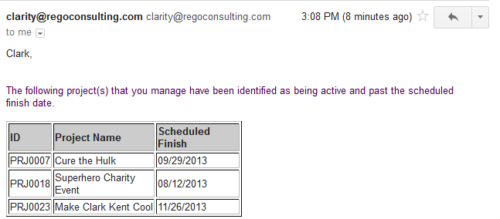 Based on the pre-determined schedule frequency, this job will send an email to Project Managers that have a project meeting the criteria of: project(s) are active and scheduled finish date is less than the current date. This serves as a reminder to Project Managers to keep their schedules true. The contents of the email include a message indicating the project manager has at least one project meeting this criteria and a table indicating the Project ID, Project Name and Scheduled Finish Date.
 -
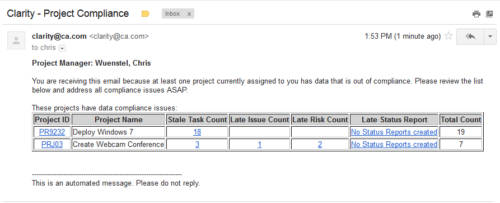 The Project Compliance Stalker – PM sends an email to Project Managers (and also their managers if so desired) at a set interval to alert them to project compliance issues. Areas of compliance that are reviewed include: stale project tasks (stale = past due date), late issues and risks (past due date) and late status reports.
 -
 When a task is marked as complete the process looks to any tasks that are dependent on the newly completed task. If a task is marked as “Not Started” and all of the dependency tasks are marked as complete then the process will change the task status to “Started” and email all resources that are assigned to the task that has started. The process notifies resources that a task is ready to start and saves the project manager the manual effort of updating dependent tasks. NOTE: The process relies on task dependencies and is most useful in those environments where task dependencies are managed.
 -
When a task is marked as complete the process looks to any tasks that are dependent on the newly completed task. If a task is marked as “Not Started” and all of the dependency tasks are marked as complete then the process will change the task status to “Started” and email all resources that are assigned to the task that has started. The process notifies resources that a task is ready to start and saves the project manager the manual effort of updating dependent tasks. NOTE: The process relies on task dependencies and is most useful in those environments where task dependencies are managed.
-
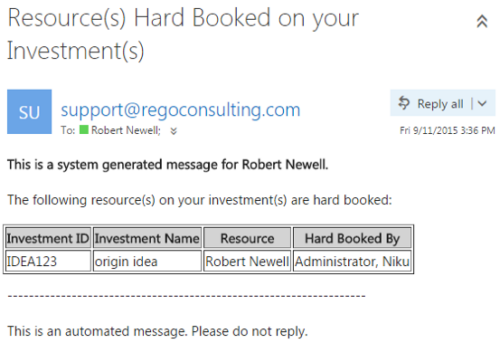 This notification process sends an email to the Manager of an investment (Project, Application, Idea, etc) when the resource assigned to the team has been hard booked. The process should be scheduled to run on a daily basis as the logic in it looks to all resources where their Booking Status has been changed from Soft to Hard on the day that the process is run. It compares the audit trail date change field to the system date. If the process is not scheduled to run daily no notification will occur on hardbookings from previous days.
 -
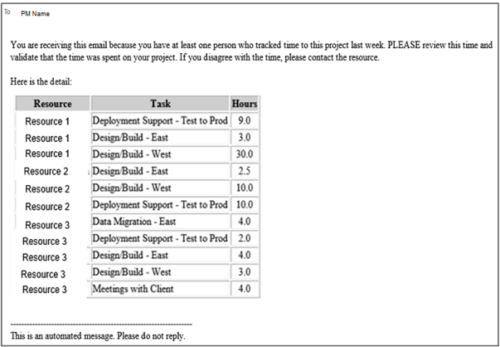 This process pulls in the total hours tracked, by resource, by task, for a given project for the weekly time period that ended. The information is sent to the Project Manager listed on the project. This process can be scheduled via the Execute a Process job.
 -
 This process updates the team, assignment and timesheet roles with the primary role where they do not match. This way, the PM can push all roles to team and assignment for that project before they do a cost plan.
 -
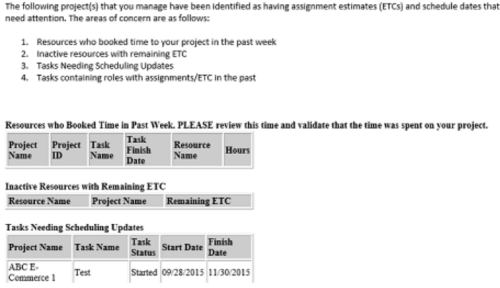 “PM Stalker – Project Validations & Issues” executes various queries against the Clarity database and sends an email to all PMs who have one or more projects with any of the following conditions:
- Resources have booked time in the past week (validation needed)
- Inactive Resources with ETCs still on the project
- Tasks past their Finish Date but not completed
- Task Role Assignments in the past
-
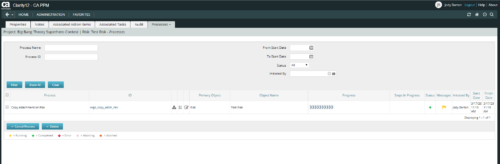 This is workflow that allows you to copy documents from one item to another. This can be altered to move documents from any place they are stored to another. In this particular instance, the focus is on moving documents from one risk to another. When creating a risk that you want to copy from, utilize the attachments section of the page and the associated lookup. The lookup is filtered to only show those risks that already have documents associated with them. Upon clicking the save button, a process runs in the background to copy the requested documents from the requested risk to this newly created risk.


Copyright 2023 • Rego Consulting Corporation • Privacy Policy