-
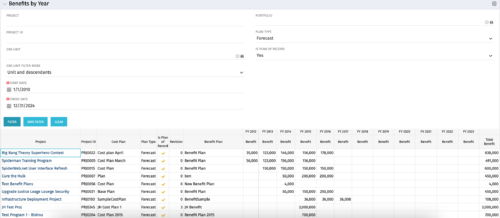 The Benefits by Year portlet summarizes Benefit totals by year and is searchable by Project, OBS and Portfolio. The results display both Budgeted Benefit Plans and Forecast Plans and the associated Cost Plan. Users can make use of this portlet to view Benefit Plan totals across an OBS or Portfolio or to compare the Budgeted Benefit of a Project versus the current plan.
 -
The Benefits by Year portlet summarizes Benefit totals by year and is searchable by Project, OBS and Portfolio. The results display both Budgeted Benefit Plans and Forecast Plans and the associated Cost Plan. Users can make use of this portlet to view Benefit Plan totals across an OBS or Portfolio or to compare the Budgeted Benefit of a Project versus the current plan.
-
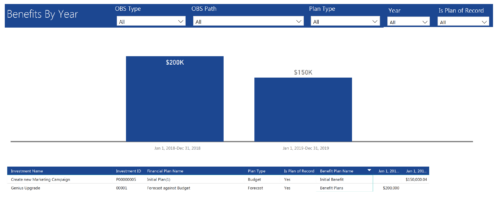 Benefits by year report provide the project manager a single place to view Benefit plan (Forecast /Budgeted) and its associated benefit for various years across multiple projects. Information is displayed in a bar graph and user can further drill down the details to investment level. Project Managers can use this report to analyze if the projects are giving intended benefits and take appropriate decisions accordingly. User can further narrow their search by OBS Type & Path, Plan Type (Budget/Forecast), Year and Is Plan of Record?.
 -
 This session will aligning you with some of the best and most common practices for using Clarity's Project Management capabilities. Come and learn about the capabilities that come out of the box for excellent project management. Things like objects, views, financial plans and general project management capabilities will be covered. Additionally, tips and tricks will be discussed leaving you with a toolkit of ideas.
 -
 This session will align you with some of the best and most common practices for using Clarity's Project Management capabilities. Come and learn about the capabilities that come out of the box for excellent project management. Things like scheduling, assignments, staffing, views, financial plans and other general project management capabilities will be covered. Additionally, tips and tricks will be discussed leaving you with a toolkit of ideas.
 -
 This session will align you with best practices for using Clarity's project management functionality. Come and learn about the OOTB capabilities for excellent project management, including: scheduling, assignments, staffing, views, financial plans, and other general project management capabilities. Additionally, tips and tricks will be shared, providing you with a toolkit of ideas for your organization!
 -

A presentation slide deck from Rego University 2022. This document reviews the best practices for project management in Clarity. - Typical PM Activities
- Use Clarity: Get Off of Excel
- Make Information Easier to Access
- Make Flags Easy to Identify
- Simplify & Automate Reporting
- Open Discussion #3
- Work with a Regular Cadence
- Sample Schedule
-
 Value Stream Management (VSM) isn’t just another buzzword; it’s the visibility layer your digital transformation is starving for. In this session, learn how to map, measure, and maximize value across the entire delivery lifecycle.
 -
 Bar Chart displays average percent variance for all active projects by OBS unit. Percent variance = Planned Cost - Budgeted Cost / Budgeted Cost * 100. Projects with no Budgeted Cost are ignored for the calculation. Then all project variance percentages are algebraically added (some may be negative), and divided by total projects with a variance. This yields the Average Percent Variance. This calculation is performed for active projects in each OBS unit. OBS units include all units at all levels where projects are attached. Portlet filterable by OBS, Financial Status, and Financially Approved. Vertical axis = OBS Unit Name. Horizontal axis = Variance Percent. Data value = Average Percent Variance. Mouseover value = OBS Name + Average Variance Percent.
 -
Bar Chart displays average percent variance for all active projects by OBS unit. Percent variance = Planned Cost - Budgeted Cost / Budgeted Cost * 100. Projects with no Budgeted Cost are ignored for the calculation. Then all project variance percentages are algebraically added (some may be negative), and divided by total projects with a variance. This yields the Average Percent Variance. This calculation is performed for active projects in each OBS unit. OBS units include all units at all levels where projects are attached. Portlet filterable by OBS, Financial Status, and Financially Approved. Vertical axis = OBS Unit Name. Horizontal axis = Variance Percent. Data value = Average Percent Variance. Mouseover value = OBS Name + Average Variance Percent.
-
Bar Chart displays average percent variance for all active projects by OBS unit. Percent variance = Planned Cost - Budgeted Cost / Budgeted Cost * 100. Projects with no Budgeted Cost are ignored for the calculation. Then all project variance percentages are algebraically added (some may be negative), and divided by total projects with a variance. This yields the Average Percent Variance. This calculation is performed for active projects in each OBS unit. OBS units include all units at all levels where projects are attached. Portlet filterable by OBS, Financial Status, and Financially Approved. Vertical axis = OBS Unit Name. Horizontal axis = Variance Percent. Data value = Average Percent Variance. Mouseover value = OBS Name + Average Variance Percent.


Copyright 2023 • Rego Consulting Corporation • Privacy Policy