-
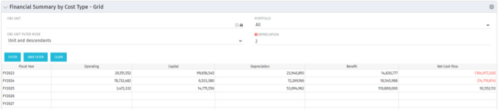 The Financial Summary by Cost Type - Grid is very beneficial as it provides actual numbers for each years financial picture beginning with current year and going forward into the future. It will show the user where they need to concentrate their efforts in order to meet financial commitments.
 -
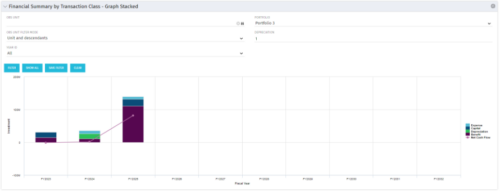 This stacked bar graph portlet displays the financial summary by transaction class for the current and future fiscal annual periods. Filters are provided for:
- OBS
- Portfolio
-
This stacked bar graph portlet displays the financial summary by transaction class for the current and future fiscal annual periods. Filters are provided for:
- OBS
- Portfolio
-
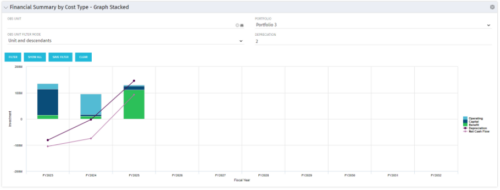 The Financial Summary by Cost Type - Graph Stacked provides a visual stacked graph for each years financial picture beginning with current year and going forward into the future. It will show the user where they need to concentrate their efforts in order to meet financial commitments.
 -
The Financial Summary by Cost Type - Graph Stacked provides a visual stacked graph for each years financial picture beginning with current year and going forward into the future. It will show the user where they need to concentrate their efforts in order to meet financial commitments.
-
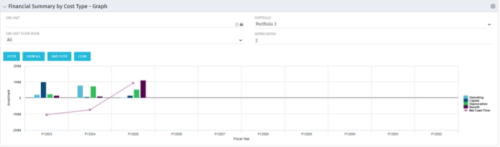 The Financial Summary by Cost Type - Graph provides a visual stacked graph for each years financial picture beginning with current year and going forward into the future. It will show the user where they need to concentrate their efforts in order to meet financial commitments.
 -
The Financial Summary by Cost Type - Graph provides a visual stacked graph for each years financial picture beginning with current year and going forward into the future. It will show the user where they need to concentrate their efforts in order to meet financial commitments.
-
The Financial Summary by Cost Type - Graph provides a visual stacked graph for each years financial picture beginning with current year and going forward into the future. It will show the user where they need to concentrate their efforts in order to meet financial commitments.
-
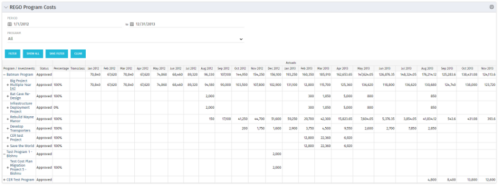 The Program Costs portlet looks like a cost plan. It will summarize all cost plans from projects within the program and display the totals.
 -
The Program Costs portlet looks like a cost plan. It will summarize all cost plans from projects within the program and display the totals.
-
The Program Costs portlet looks like a cost plan. It will summarize all cost plans from projects within the program and display the totals.
-
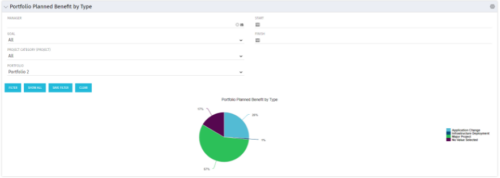 Part of the Business Transformation collection, this pie chart portlet displays realized benefit, grouped by type of project, for portfolio investments. It uses System Provider: Portfolio Investment Provider.


Copyright 2023 • Rego Consulting Corporation • Privacy Policy