-
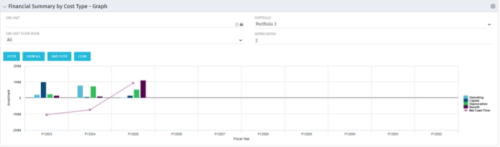 The Financial Summary by Cost Type - Graph provides a visual stacked graph for each years financial picture beginning with current year and going forward into the future. It will show the user where they need to concentrate their efforts in order to meet financial commitments.
 -
The Financial Summary by Cost Type - Graph provides a visual stacked graph for each years financial picture beginning with current year and going forward into the future. It will show the user where they need to concentrate their efforts in order to meet financial commitments.
-
The Financial Summary by Cost Type - Graph provides a visual stacked graph for each years financial picture beginning with current year and going forward into the future. It will show the user where they need to concentrate their efforts in order to meet financial commitments.
-
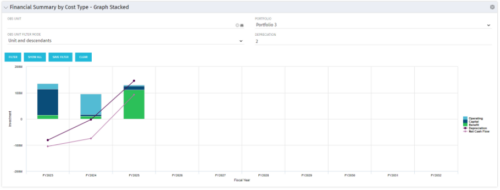 The Financial Summary by Cost Type - Graph Stacked provides a visual stacked graph for each years financial picture beginning with current year and going forward into the future. It will show the user where they need to concentrate their efforts in order to meet financial commitments.
 -
The Financial Summary by Cost Type - Graph Stacked provides a visual stacked graph for each years financial picture beginning with current year and going forward into the future. It will show the user where they need to concentrate their efforts in order to meet financial commitments.
-
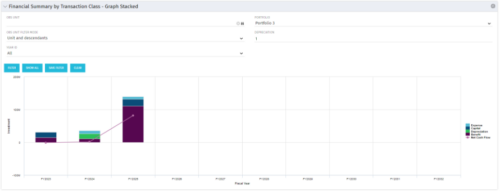 This stacked bar graph portlet displays the financial summary by transaction class for the current and future fiscal annual periods. Filters are provided for:
- OBS
- Portfolio
-
This stacked bar graph portlet displays the financial summary by transaction class for the current and future fiscal annual periods. Filters are provided for:
- OBS
- Portfolio
-
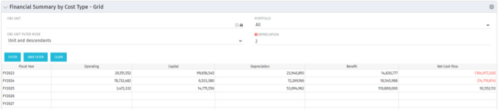 The Financial Summary by Cost Type - Grid is very beneficial as it provides actual numbers for each years financial picture beginning with current year and going forward into the future. It will show the user where they need to concentrate their efforts in order to meet financial commitments.
 -
The Financial Summary by Cost Type - Grid is very beneficial as it provides actual numbers for each years financial picture beginning with current year and going forward into the future. It will show the user where they need to concentrate their efforts in order to meet financial commitments.
-
 A Quick Reference Guide to assist in entering financial transactions into Clarity’s Classic UX. The guide reviews the basics of transactions entry, create voucher header, entering the line item - details, and entering the line item - transaction.
 -
 The Financial Summary by Transaction Class - Graph provides a visual graph for each years financial picture beginning with current year and going forward into the future. It will show the user where they need to concentrate their efforts in order to meet financial commitments.
 -
The Financial Summary by Transaction Class - Graph provides a visual graph for each years financial picture beginning with current year and going forward into the future. It will show the user where they need to concentrate their efforts in order to meet financial commitments.


Copyright 2023 • Rego Consulting Corporation • Privacy Policy