RM Dashboard (Power BI)
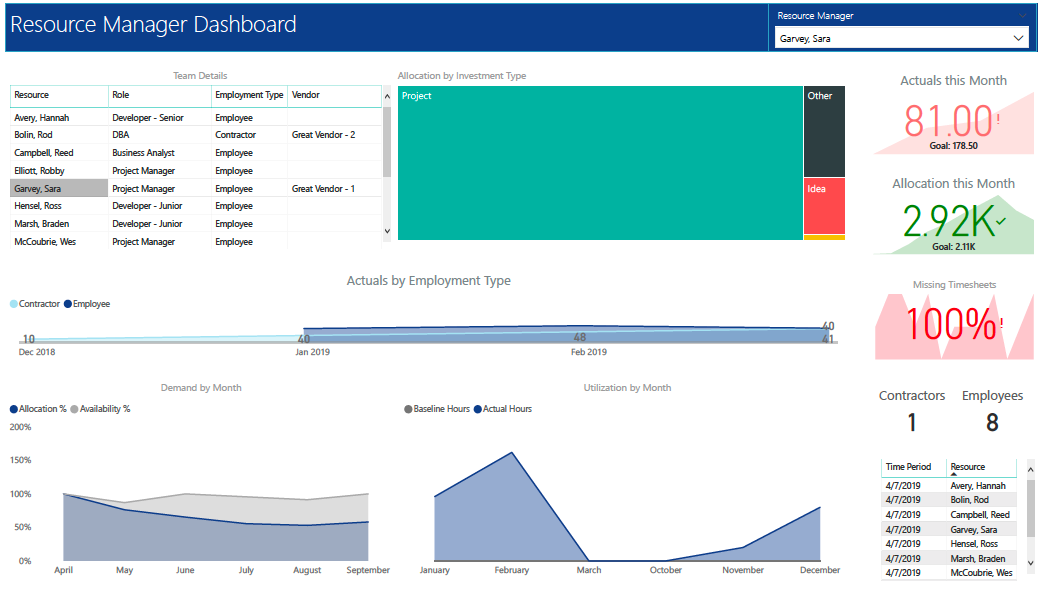
RM Dashboard shows various KPIs like Actuals posted by the resources in last month, Allocation in current month, count of missed timesheets etc.
Team Details – Grid report providing list of all the resources managed by a resource manager.
Allocation by Investment type – Tree graph displaying distribution pattern of allocation hours across different investment types.
Actuals by Employment Type – Area graph, displaying actual hours posted by Employees Vs Contractors.
Demand by Month – Area graph, displaying Allocation Vs Availability for next 6 months.
Utilization by Month – Area graph, displaying Baseline Vs Actuals hours over last 6 months.
Download Details
RegoXchange Content ID: EX1669
Submission Date:
Submitter:
Content Type: Business Intelligence
Related Modules: Resource Management
Company: Rego Consulting
Version Support
Versions Supported: 15.x, 16.x
Special Instructions
Special Instructions:


