Projects by Stage & Manager w/ Drilldown – Postgres
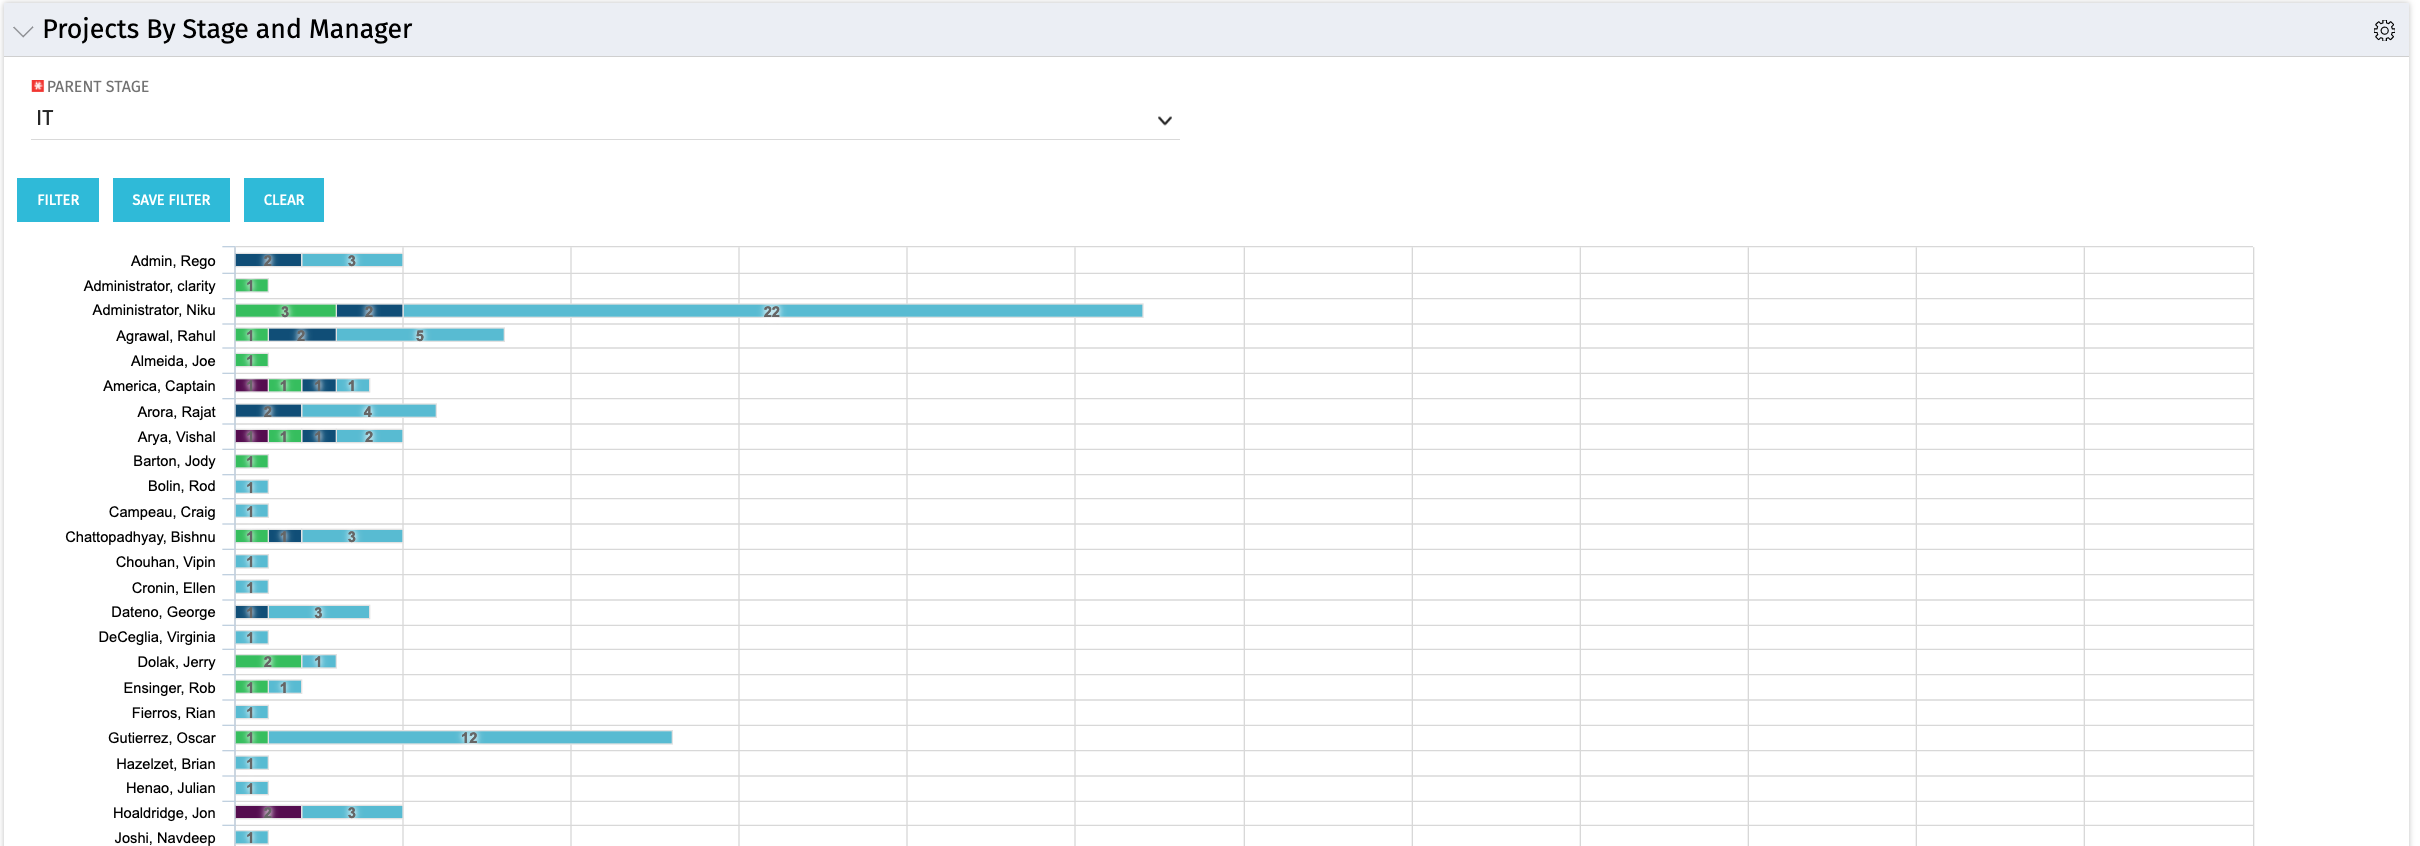
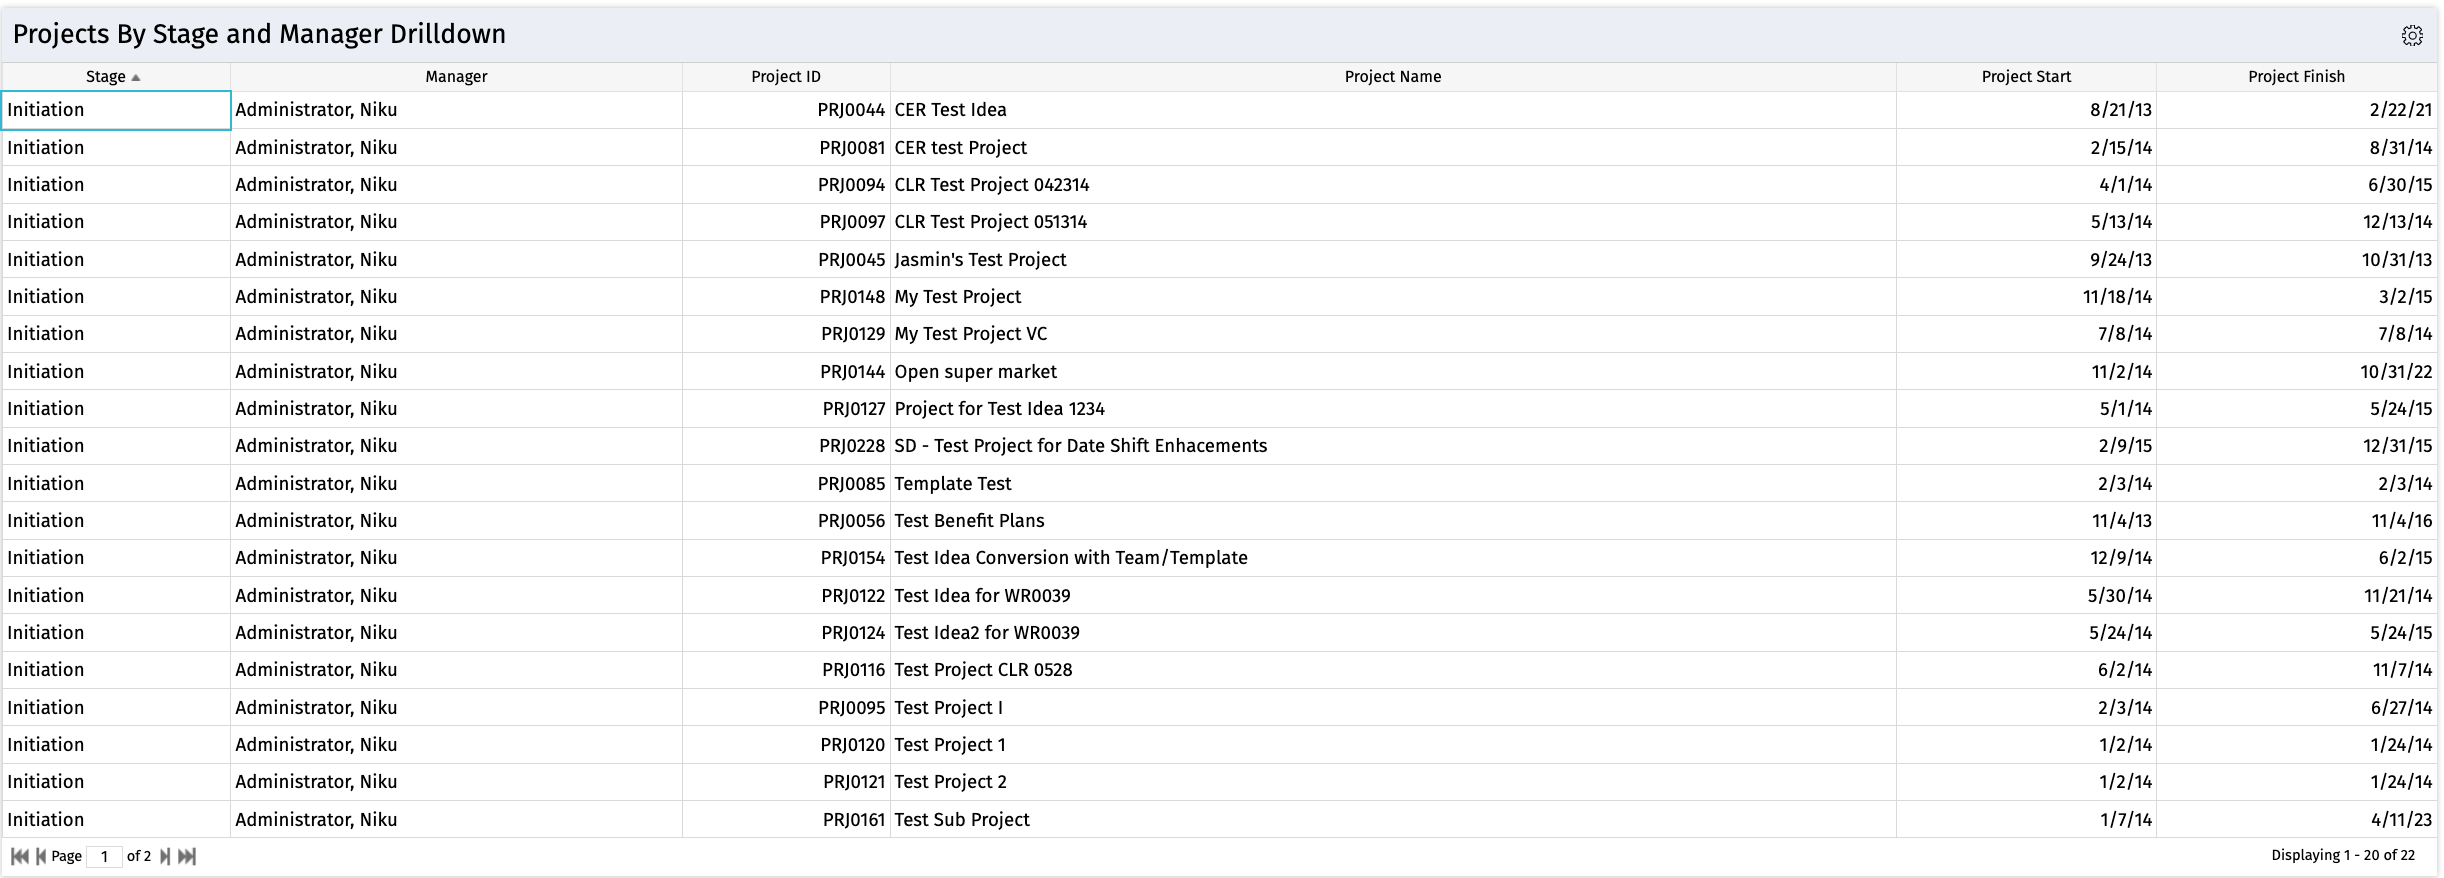
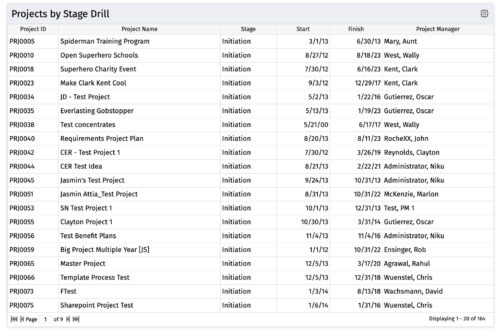
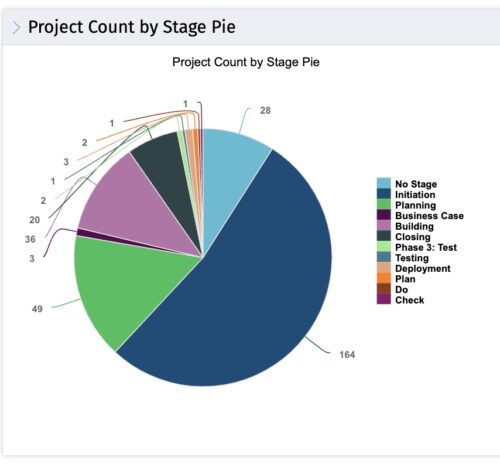
Horizontal Bar Chart displays one bar per manager (manager name on vertical axis). Horizontal axis shows project count. Filtered by Parent Stage. Each bar shows color coded stages, where length of each color is proportional to the count. Data label = count by stage. Mouse-over = stage name and percent count of total projects. Legend = child stage names. Drilldown functionality: Clicking on a bar color yields a project grid portlet with projects in that stage for that manager.
Download Details
RegoXchange Content ID: EX1072
Submission Date:
Submitter:
Content Type:
Related Modules: Project Management
Company: Rego Consulting
Version Support
Versions Supported: 15.x, 16.x
Special Instructions
Special Instructions: Please note that the appropriate rights need to be specified against the portlets and pages if users do not have global rights to see all. If portlets and page rights are instance based, please grant instance rights to both portlets in this package as well as the page in which the drilldown portlet sits on.