Project Health by PM (Power BI)
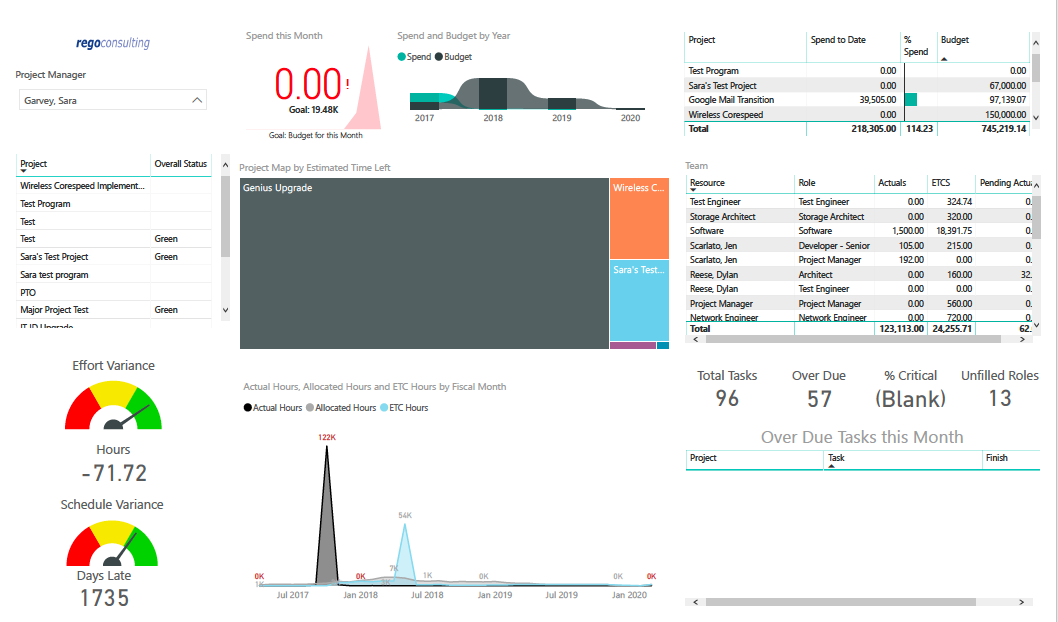
Project Health by PM is a dashboard that contains multiple visualizations showing various KPIs of projects managed by a project manager.
Dashboard shows KPIs like summary of Over Due tasks, Critical tasks, Unfilled roles on Project, Effort and Schedule variance etc.
Spend this month – Area graph that shows Actual vs Budget cost for current month.
Spend and Budget by Year – Ribbon chart that shows yearly distribution of Actual vs Budget cost.
Project Map by Estimated time left – Tree map representing ETC hours remaining on each project.
Team – Grid section that shows list of team members with respective Actuals and ETC hours.
Actual Hours, Allocated Hours and ETC Hours by Fiscal Month – Area graph that shows monthly distribution of Actuals vs Allocation vs ETC.
Download Details
RegoXchange Content ID: EX1668
Submission Date:
Submitter:
Content Type: Business Intelligence
Related Modules: Project Management
Company: Rego Consulting
Version Support
Versions Supported: 15.x, 16.x
Special Instructions
Special Instructions:


