Financial Summary by Cost Type – Graph – SQL
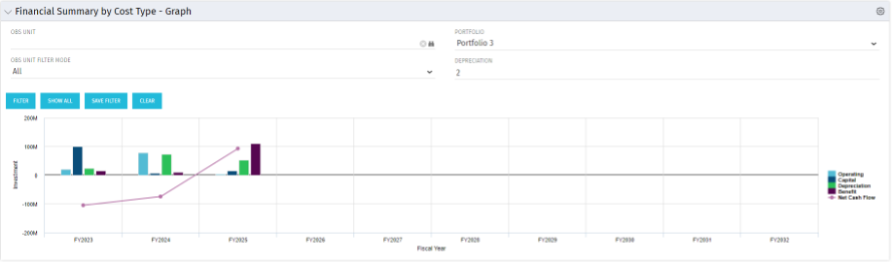
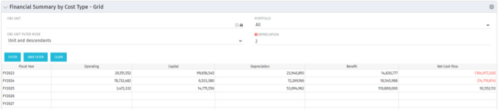
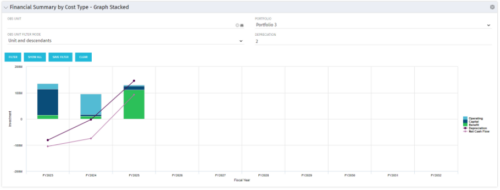
The Financial Summary by Cost Type – Graph provides a visual stacked graph for each years financial picture beginning with current year and going forward into the future. It will show the user where they need to concentrate their efforts in order to meet financial commitments.
Download Details
RegoXchange Content ID: EX1650
Submission Date:
Submitter:
Content Type: Clarity Studio
Related Modules: Financial Management
Company: Rego Consulting