Financial Summary by Charge Code – Graph – SQL
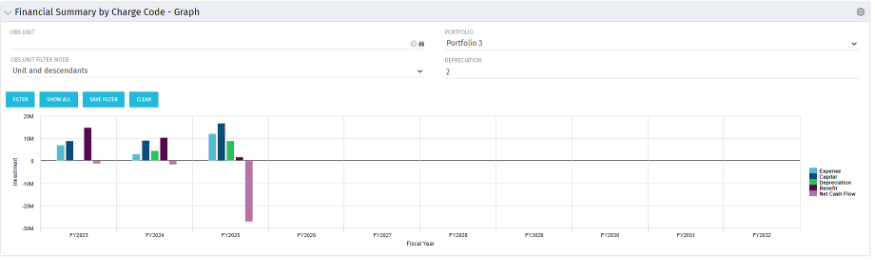
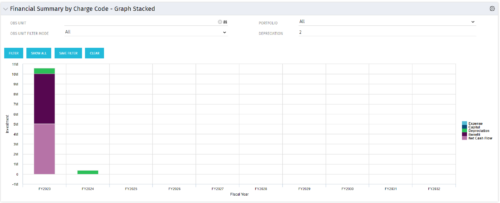
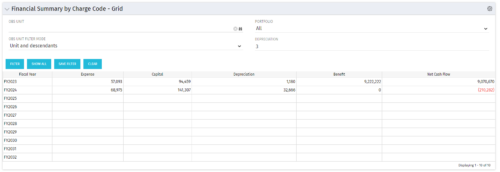
The Financial Summary by Charge Code – Graph portlet displays yearly charge code financial information across all projects in a bar graph. This portlet provides management with a snapshot of all projects’ financial information totaled and sorted by expense, capital, depreciation, benefit, and net cash flow. The depreciation is calculated based on a straight line method. The user may filter on OBS unit and/or portfolio to narrow down the search results.
Download Details
RegoXchange Content ID: EX243
Submission Date:
Submitter:
Content Type: Clarity Studio
Related Modules: Financial Management
Company: Rego Consulting
Version Support
Versions Supported: 15.x, 16.x+
Special Instructions
Special Instructions: This portlet assumes the Clarity instance has charge codes setup for Capital and Expense. It requires the charge code IDs to match exactly “Capital” and “Expense”. To verify the charge code IDs for the Clarity instance that this portlet will be installed on, navigate to Administration > Project Management > Charge Codes. If the IDs of the Capital and Expense charge codes are not “Capital” and “Expense” the query must be modified. Change the ‘Capital’ and ‘Expense’ values on lines 420 and 421 of the XML XOG file to match the IDs found in the destination instance of Clarity.