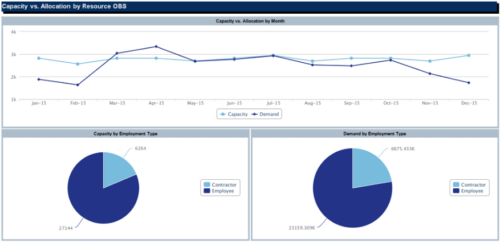
Capacity Graph (Power BI)
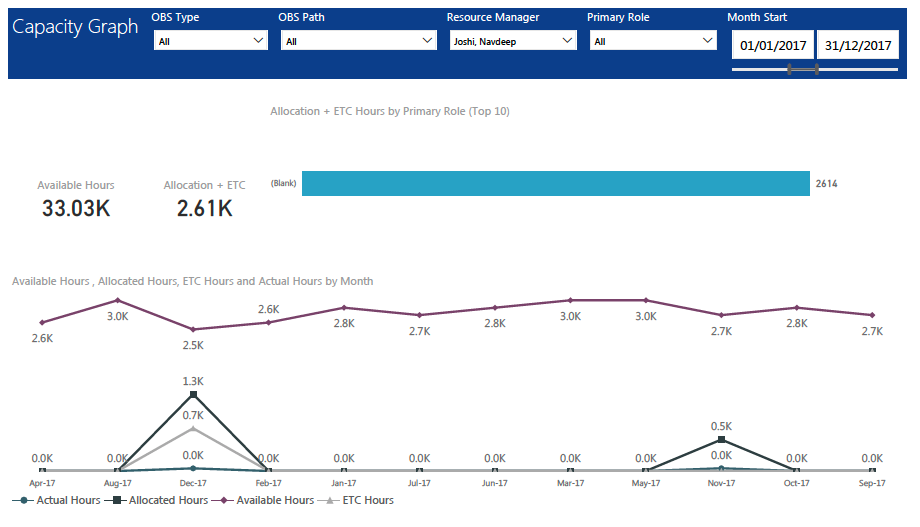
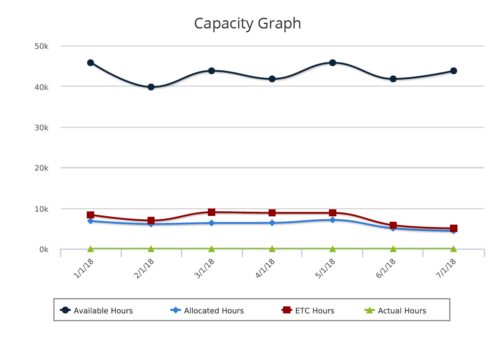
Capacity Graph report displays Availability, Allocations, Actuals and Assignments for one or more active resource(s) in a single view. Report contains the following components:
KPIs: Displays Available hours, Allocation + ETC for filtered criteria.
Bar graph: Displays Allocation + ETC by primary role
Line chart: Displays Availability, Allocations, Actuals and Assignments by time period.
This portlet provides Resource Managers, PMOs and Executives with a simple way to analyze: Allocations vs. Availability, Allocations vs. Actuals, Allocations vs. ETC and ETC vs. Availability.
User can further narrow their search by OBS Type & Path, Resource Manager, Primary Role, Start and End Date.
Download Details
RegoXchange Content ID: EX1666
Submission Date:
Submitter:
Content Type: Business Intelligence
Related Modules: Project Management
Company: Rego Consulting
Version Support
Versions Supported: 15.x, 16.x
Special Instructions
Special Instructions:

