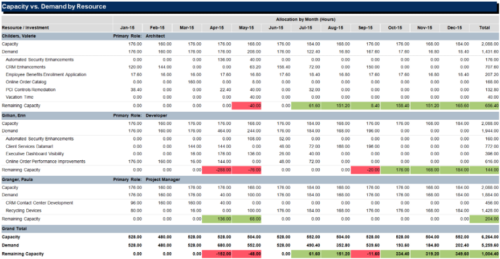
Capacity Graph (JS Report)
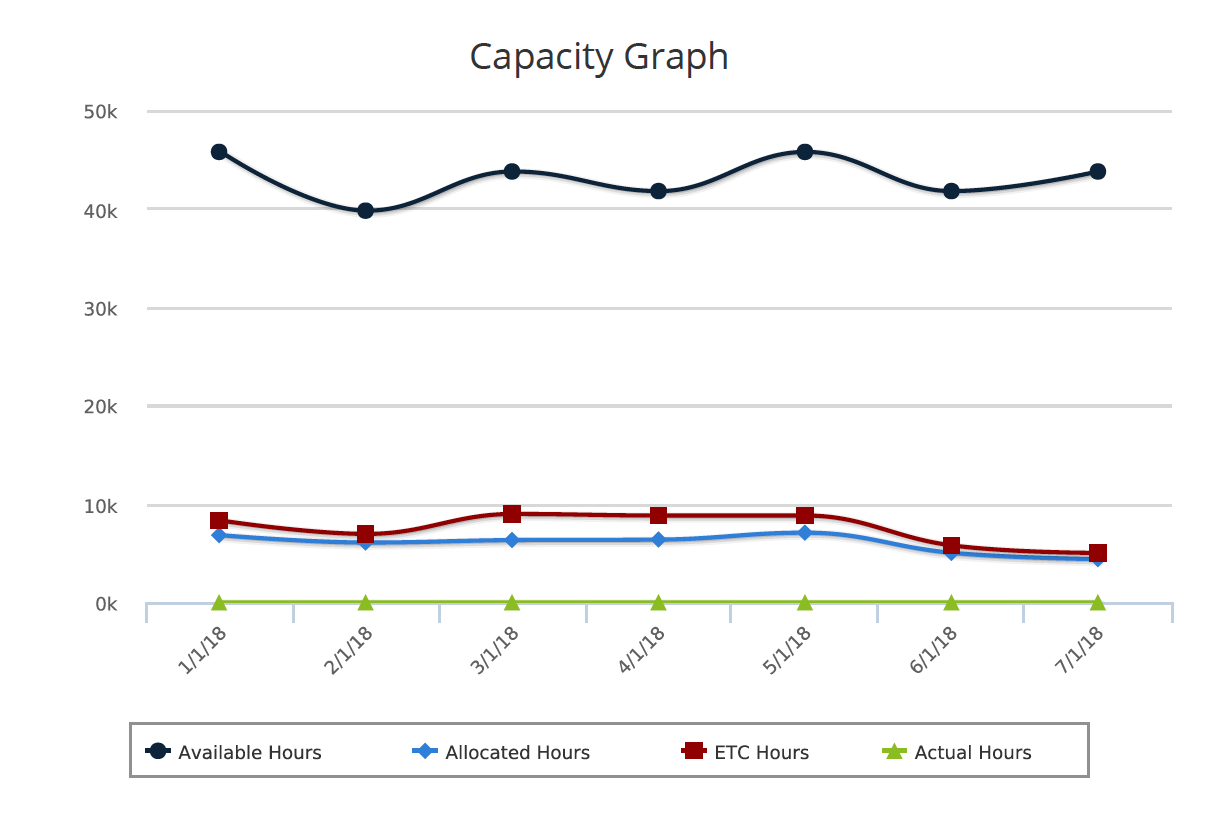
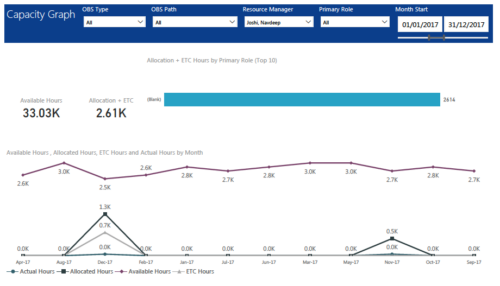
Capacity Graph report provides the Resource Managers & PMO a single place to view Monthly Availability, Allocations, Actuals and Assignments for one or more active resources. Information is displayed in the form of a line chart.
Legend displays the color associated with each metric. Mouse over the line chart displays hours associated with that corresponding metric.
This report provides Managers a simple means to analyze: Allocations vs. Availability, Allocations vs. Actuals, Allocations vs. ETC and ETC vs. Availability and helps in determining the areas of improvement.
User can further narrow their search by OBS Type & Path, Month Start Date, Resource Name, Resource Manager, Primary Role & Employment Type.
Download Details
RegoXchange Content ID: EX1447
Submission Date:
Submitter:
Content Type: Business Intelligence
Related Modules: Project Management
Company: Rego Consulting
Version Support
Versions Supported: 15.x, 16.x
Special Instructions
Special Instructions:

