All Status Reports (Power BI)
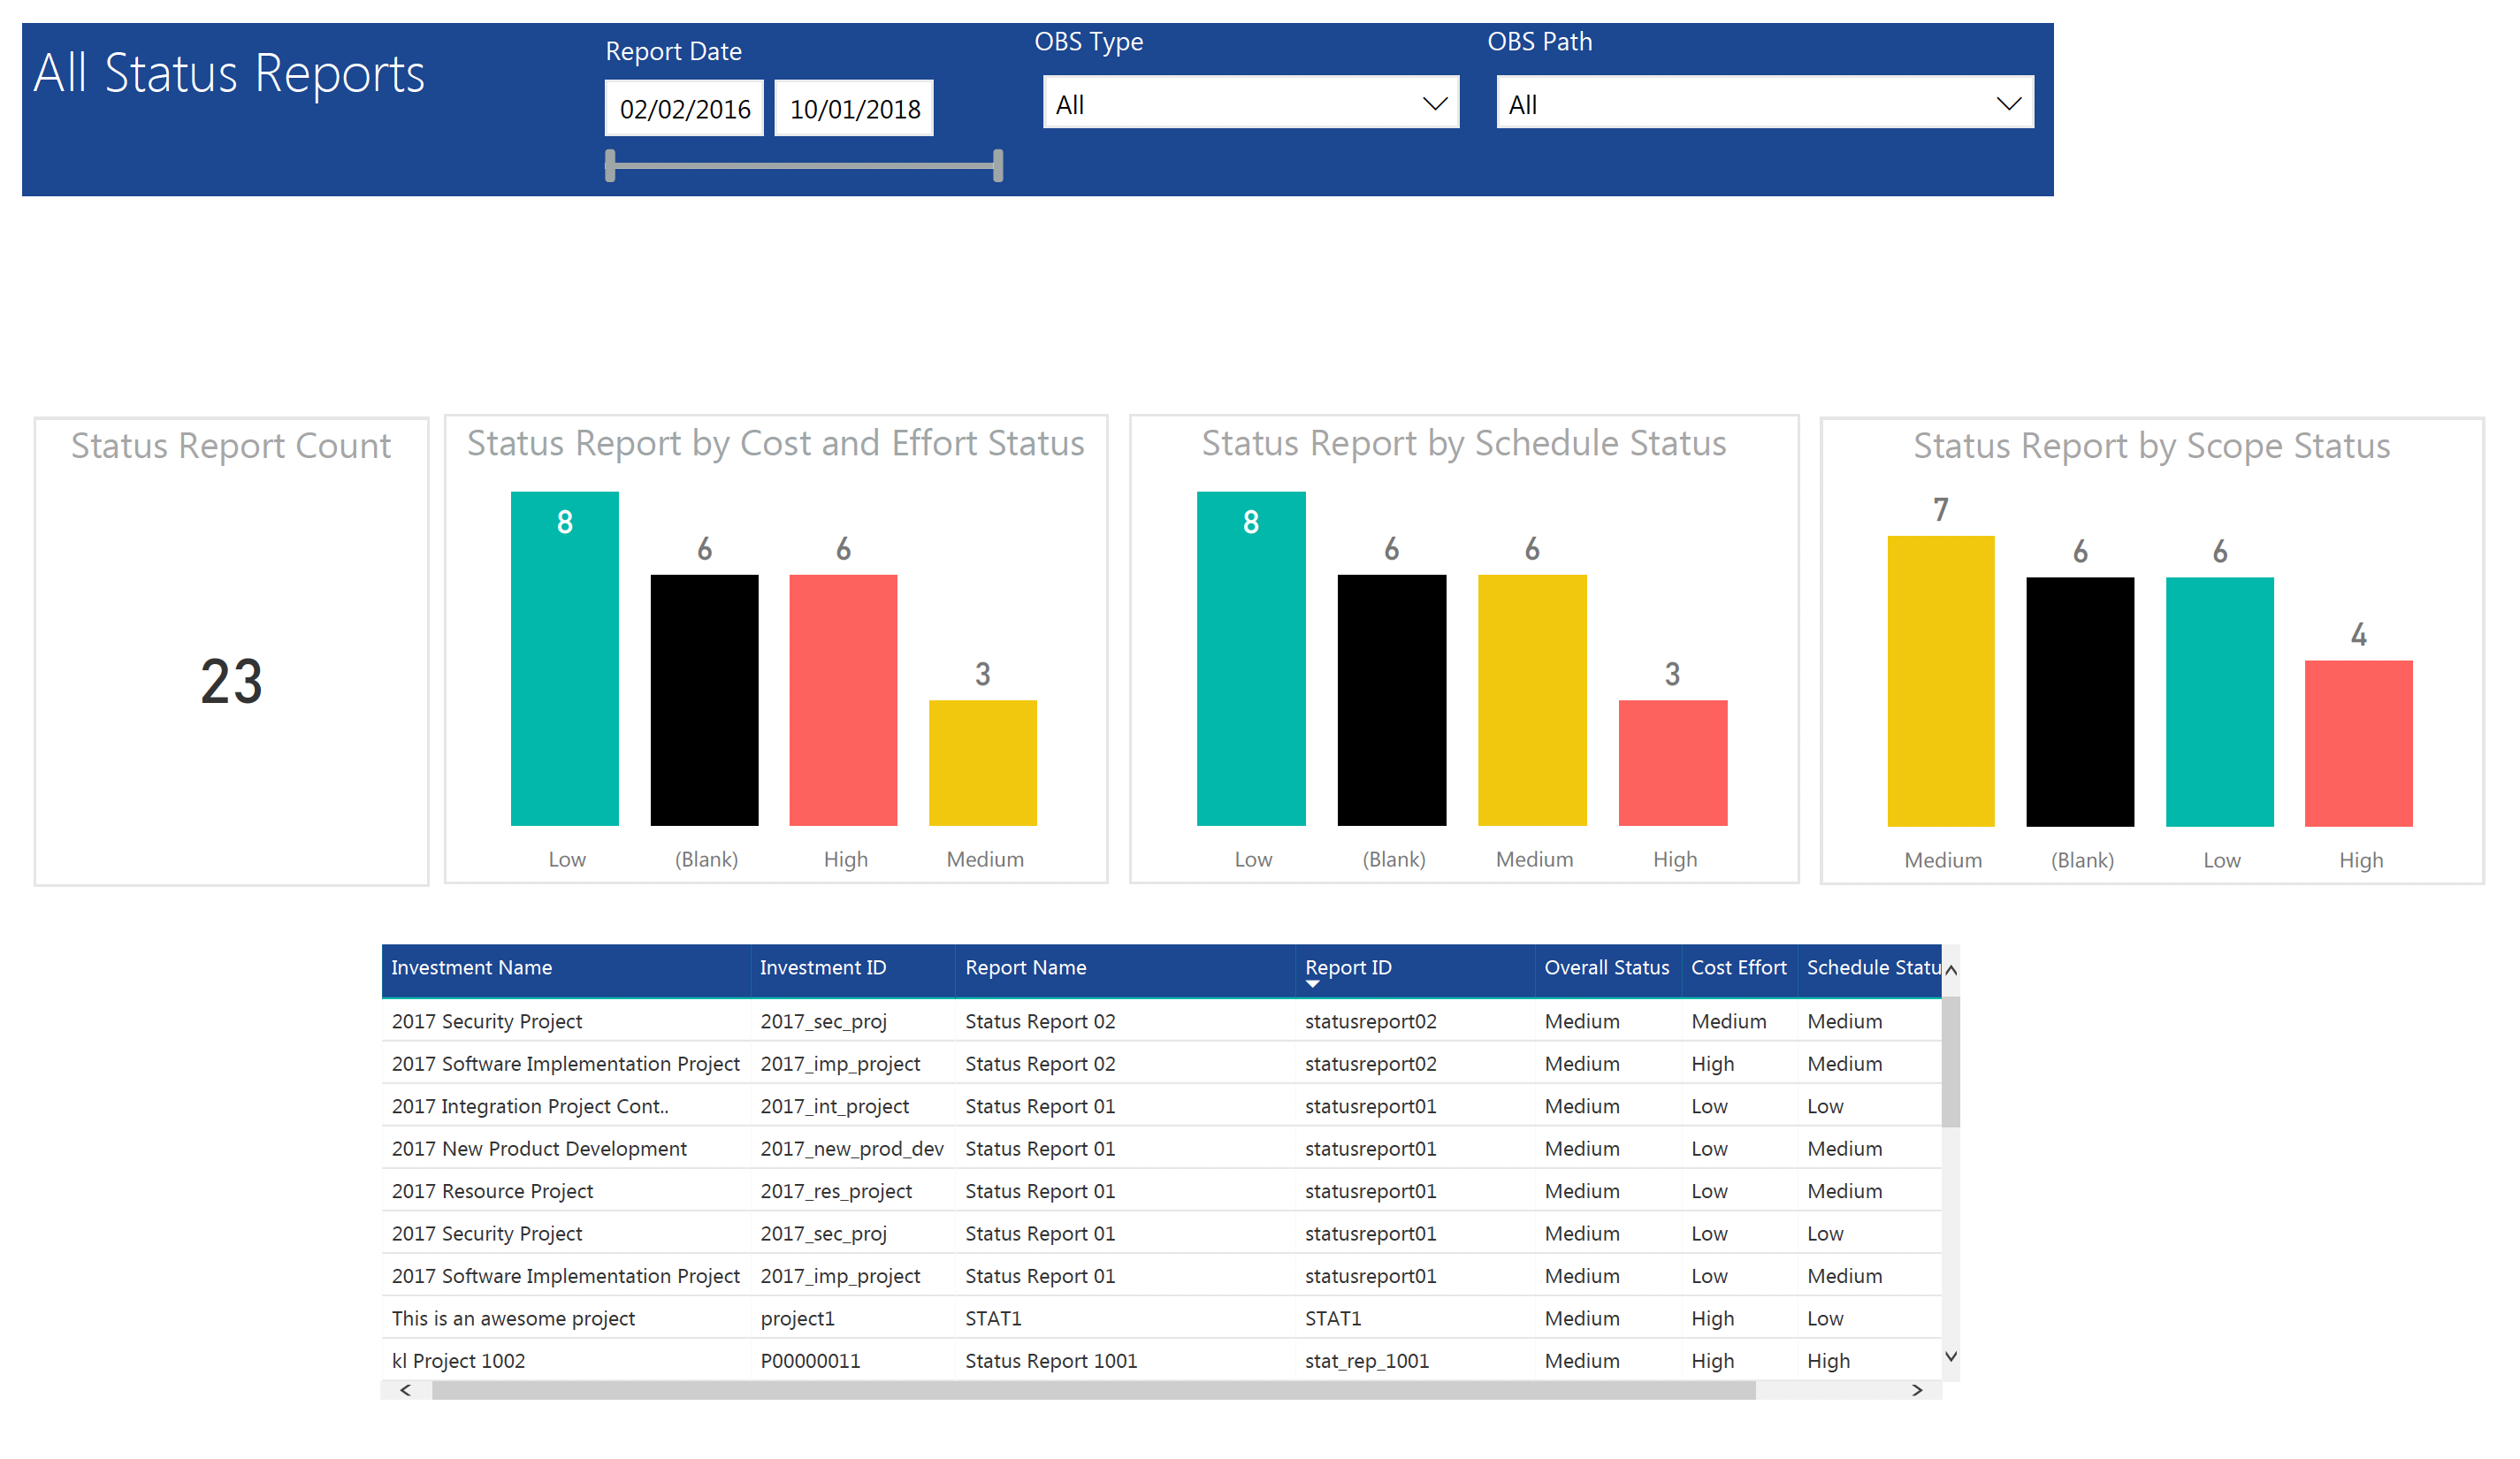
All Status report provides project managers a single place to view KPIs related to Status Reports. All the KPIs are depicted in various visualizations.
Status Report Count: Scorecard that displays the # of Status Reports for the selected criteria.
Status Report by Cost Effort Status: Column chart that displays # of Status Reports by Cost Effort. X axis displays various Cost Effort Status. Data labels indicate the number of Status Reports associated with that category.
Status Report by Schedule Status: Column chart that displays # of Status Reports by Schedule Status. X axis displays various Schedule statuses. Data labels indicate the number of Status Reports associated with that status.
Status Report by Scope Status: Column chart that displays # of Status Reports by Scope Status. X axis displays various Scope statuses. Data labels indicate the number of Status Reports associated with that status.
Grid: Displays Status Report details such as Investment ID, Investment Name, Report Name, Report ID, Overall Status, Cost Effort, Schedule Status and Scope Status.
You can further narrow your search by OBS Type, OBS Path and Report Date range
Download Details
RegoXchange Content ID: EX1634
Submission Date:
Submitter:
Content Type: Business Intelligence
Related Modules: Project Management
Company: Rego Consulting
Version Support
Versions Supported: 15.x, 16.x
Special Instructions
Special Instructions:

