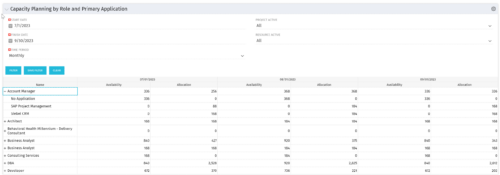
Capacity Graph – Investment – SQL
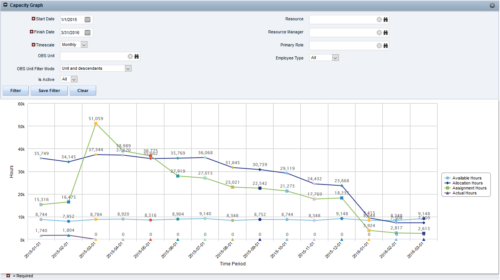
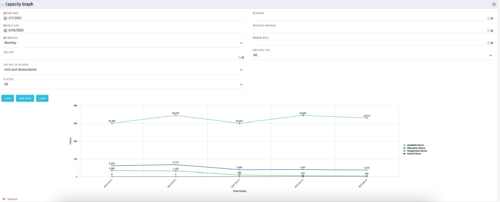
The Capacity Graph – Investment portlet displays Availability, Allocations, Assignments and Actuals for active resources in a single project. This portlet pulls from timeslices and allows the user to filter on weekly, monthly, or quarterly data.
This portlet provides a Project Manager with a simple way to analyse: Allocations vs. Actuals and Allocations vs. ETC. Depending on metric goals, the graph allows the user to determine where areas of improvement may exist.
Download Details
RegoXchange Content ID: EX0026
Submission Date:
Submitter:
Content Type: Clarity Studio
Related Modules: Allocations
Company: Rego Consulting
Version Support
Versions Supported: 15.x, 16.x
Special Instructions
Special Instructions:


