-
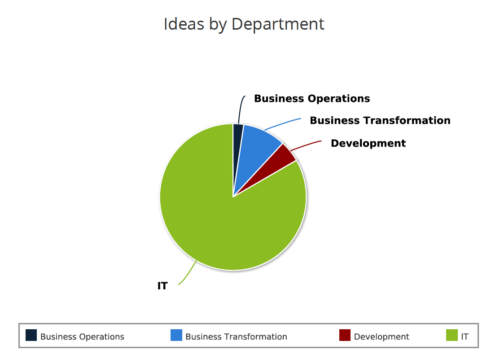 Ideas by Department report is a pie chart that displays count of ideas by department. Mouse over on the pie chart displays idea count for that department. You can further narrow your search by OBS Type & Path , Idea Status, Idea Start Date and Is Idea Active?.
 -
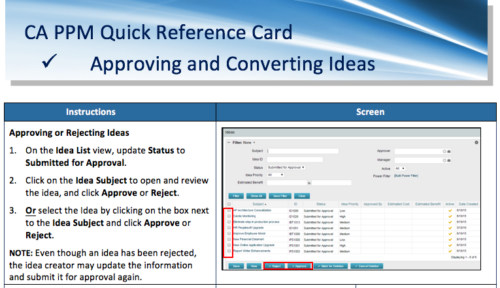 A Quick Reference Card to assist in the approving/rejecting of Ideas. Included converting Ideas once approved.
 -
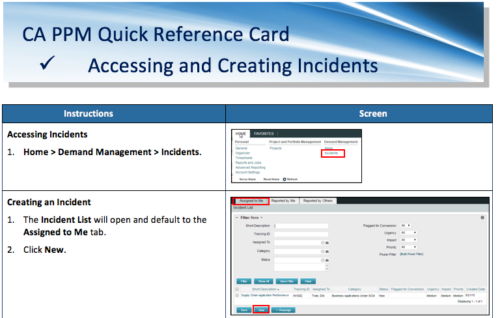 A Quick Reference Card to assist in the accessing and creation of Incidents in CA PPM. Incidents can be found by going to Home, then Demand Management to the Incident list menu item.
 -
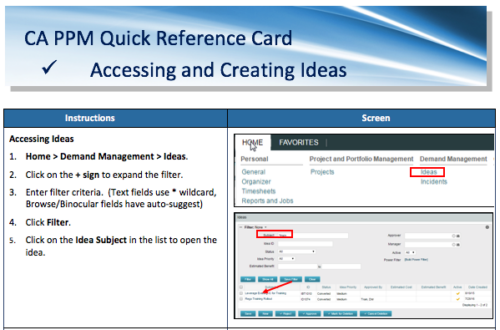 A Quick Reference Card to assist in the creation of Ideas in CA PPM. Ideas are created by going to Home, then Demand Management and choosing Ideas from the list menu.
 -
This course will provide an overview of CA PPM Demand Management functionality. Topics include: - What is Demand Management?
- Accessing and Creating Ideas
- Staffing the Idea Team
- Creating and Approving Idea Financial Plans
- Idea Conversion to another Investment Type
- Accessing and Creating Incidents
- Adding Incident Tasks to a Project
-
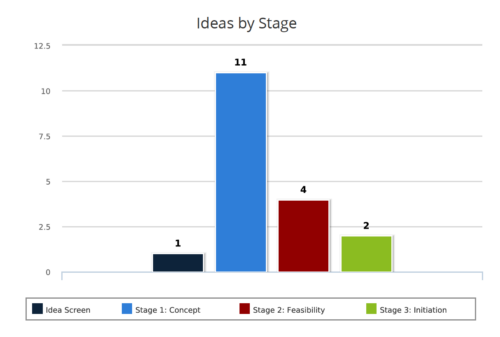 Ideas by Stage report is a column chart that displays ideas count by its Stage. Legend displays Stage names. Numerical value on the column bar indicates the idea count for that stage. You can further narrow your search by OBS Type & Path, Idea Status, Idea Start Date and Is Idea Active?
 -
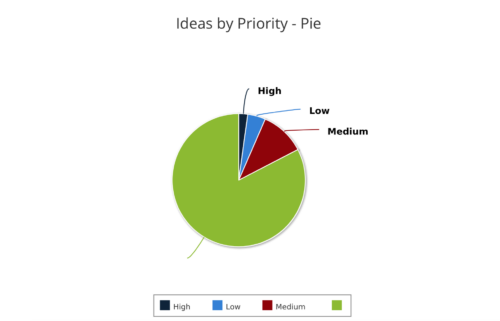 Ideas by Priority report is a pie chart that displays ideas count by priority. Mouse over on the pie chart displays idea count for that priority. You can further narrow your search by OBS Type, OBS Path, Idea Status, Idea Start Date and Is Idea Active?
 -
 Ideas by Business Unit report is a pie chart that displays count of ideas per business unit. This report gives a holistic view of the idea pipeline in an Organization and provides information on number of ideas converted, approved & unapproved per business unit. You can further narrow your search by Idea Status, Ideas Start Date and Is Idea Active?.
 -
 Course Description: “For clients that have both ServiceNow and CA PPM, passing information between the systems becomes vital for the enterprise with both ITSM and PPM toolsets. One of the biggest areas of interaction is around Demand Management. Come and see Rego's Integration solution which flexibly allows for ServiceNow records (Incident, Problem, Idea, Enhancement, and Demands) to generate CA PPM Ideas or Projects. This lets you control where you want to perform Demand Management, and the work lands in CA PPM's Project either way.” Download is the slide deck used for the presentation.
 -
 Course Description: Struggling to figure out how to best organize your blueprints? This class will walk through best practice blueprint design, including how many to have, how to use channels, using custom subobjects within the blueprint, and swapping blueprints at various project stages to mimic project phases or ideas. We’ll highlight some of the creative ways we’ve seen blueprints used in client implementations.
 -
 Course Description: For clients that have both ServiceNow and Clarity PPM, passing information between the systems becomes vital for the enterprise with ITSM, demand, and PPM toolsets. One of the biggest areas of interaction is around demand management. Come and see Rego's integration solution, which flexibly allows for ServiceNow records (incident, problem, idea, enhancement, and demands) to generate Clarity PPM ideas or projects.
 -
 Do you want to talk to other customers that are using or plan to use demand management? In this moderated round table, customers can share experiences and provide insights on process, configurations, challenges, and successes. We will divide into small groups and discuss customer selected topics—100% sharing.
 -
 Do you want to understand the OOTB configuration and functionality of demand management? In this class, we will review the OOTB objects, views, and functions of ideas, incidents, and other related areas. We will cover both Classic Clarity and the Modern UX, highlighting differences.
 -
 Are you starting a demand management implementation? Do you want to compare how you are using these functions vs. how others are using them? In this class, we will discuss some best practices from successful customers.
 -
 Are you looking for some great examples of dashboards that include metrics/KPIs? This session will review a host of sample metric dashboards in use today that can spark ideas for you to implement in your company.
 -
 Funnel Chart displays aggregated counts of Ideas by “Idea Progress”, a custom attribute. Chart shows Idea Progress names in legend, and count total is available as a mouse-over. No filters available on this portlet.
 -
Funnel Chart displays aggregated counts of Ideas by “Idea Progress”, a custom attribute. Chart shows Idea Progress names in legend, and count total is available as a mouse-over. No filters available on this portlet.
-
Funnel Chart displays aggregated counts of Ideas by “Idea Progress”, a custom attribute. Chart shows Idea Progress names in legend, and count total is available as a mouse-over. No filters available on this portlet.
-
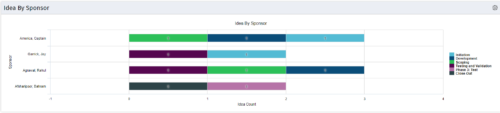 This portlet uses a bar graph to show the count of ideas by stage - grouped by the sponsor OBS. The X-axis displays the count and the Y-axis denotes the sponsor.
 -
This portlet uses a bar graph to show the count of ideas by stage - grouped by the sponsor OBS. The X-axis displays the count and the Y-axis denotes the sponsor.
-
This portlet uses a bar graph to show the count of ideas by stage - grouped by the sponsor OBS. The X-axis displays the count and the Y-axis denotes the sponsor.
-
 Pie Chart displays total Ideas by Priority, filterable by Active / Inactive and by OBS structure. Data Label and Mouse-over label display counts by Priority. Legend shows Priority Name. Chart also shows Ideas with No Priority.
 -
Pie Chart displays total Ideas by Priority, filterable by Active / Inactive and by OBS structure. Data Label and Mouse-over label display counts by Priority. Legend shows Priority Name. Chart also shows Ideas with No Priority.
-
 Pie Chart displays count of all Ideas by Department. Filterable by Active and Inactive, by OBS, and by Department Manager. Data label and mouse-over show department counts. Legend displays department names.
 -
Pie Chart displays count of all Ideas by Department. Filterable by Active and Inactive, by OBS, and by Department Manager. Data label and mouse-over show department counts. Legend displays department names.
-
Pie Chart displays count of all Ideas by Department. Filterable by Active and Inactive, by OBS, and by Department Manager. Data label and mouse-over show department counts. Legend displays department names.
-
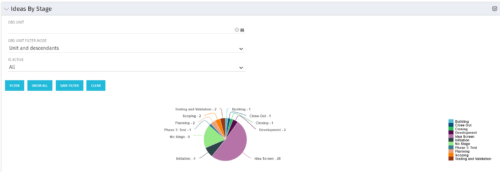 Pie Chart displays count of all Ideas by stage. Filterable by Active and Inactive, and also by OBS. Data label and mouse-over show Stage counts. Legend displays Stage names. This portlet assumes the use of the custom Stage attribute on Idea object.
 -
Pie Chart displays count of all Ideas by stage. Filterable by Active and Inactive, and also by OBS. Data label and mouse-over show Stage counts. Legend displays Stage names. This portlet assumes the use of the custom Stage attribute on Idea object.
-
Pie Chart displays count of all Ideas by stage. Filterable by Active and Inactive, and also by OBS. Data label and mouse-over show Stage counts. Legend displays Stage names. This portlet assumes the use of the custom Stage attribute on Idea object.
-
 Are you looking for some great examples of dashboards that include metrics/KPIs? This session will review a host of sample metric dashboards in use today that can spark ideas for you to implement in your company.
 -
 This training document is a Rego Consulting Quick Reference Guide to assist with the adding of resources to the Staff tab for Ideas in Clarity’s Modern User Experience. This doc references version 16.1 views. Document provides detail on how to add resources to the Staff tab, Default Allocation % and Per-Period metrics.
 -
 This training document is a Rego Consulting Quick Reference Guide to assist with the creation of financial plans within Ideas in Clarity’s Modern User Experience. This doc references version 16.1 views. Document includes instructions on how to create cost plans, budget plans and benefit plans.
 -
 This training document is a Rego Consulting Quick Reference Guide to assist with the creation and management of Ideas in Clarity’s Modern User Experience. This doc references version 16.1 views. Doc covers creation of ideas, adding columns to the grid view and editing existing ideas.
 -
 This training document is a Rego Consulting Quick Reference Guide to assist with Idea approval and conversion to projects in Clarity’s Modern User Experience. This doc references version 16.1 views. Doc reviews setting Ideas as Approved and converting Ideas to projects.
 -
 A presentation slide deck from Rego University 2022. This document reviews best practices for Demand Management.
- Define Demand for your organization
- Support the Planning business process directly in Clarity
- Think through the process to standardize forms and required data – from capturing the data to leveraging it in views, Roadmaps, Hierarchies and/or reports
- Identify and engage Users and Consumers
- Keep it simple: Understand expected business outcomes when defining required fields, and eliminate everything that isn’t necessary
-
 A presentation slide deck from Rego University 2022. This document reviews the discussion around AI and the more realistic option of Predictive Modeling that exists in the near future of PPM. Then the group worked on ideas to bring to PPM tools via PM.
- Predictive Modeling / AI Trend
- Why are we here? Goals for this session
- Creativity Workshop - Brainstorming
- Summary of Themes
- Qualify top Themes


Copyright 2023 • Rego Consulting Corporation • Privacy Policy